> ## Documentation Index
> Fetch the complete documentation index at: https://gcore.com/docs/llms.txt
> Use this file to discover all available pages before exploring further.
# View GCore managed logging logs in Grafana with OpenSearch plugin
The [OpenSearch Grafana Data Source](https://grafana.com/grafana/plugins/grafana-opensearch-datasource/?tab=overview) plugin allows you to integrate logs from OpenSearch Dashboards into Grafana. This means that you get a consolidated view of all your metrics in one place and benefit from Grafana's advanced alerting and visualization features. You also gain full control over who can view and manage your logs, ensuring the protection of any sensitive information.
## Step 1. Set up Managed Logging in the GCore customer portal
To enable OpenSearch integration with Grafana, you need to configure Managed Logging in the Gcore Customer Portal. You can find more information in our guide on [configuring Managed Logging and viewing your logs](/cloud/logging-as-a-service/configure-logging-and-view-your-logs).
## Step 2. Install OpenSearch plugin in Grafana
If you've already installed the plugin, skip these instructions and go to **Step 3**.
To install the plugin:
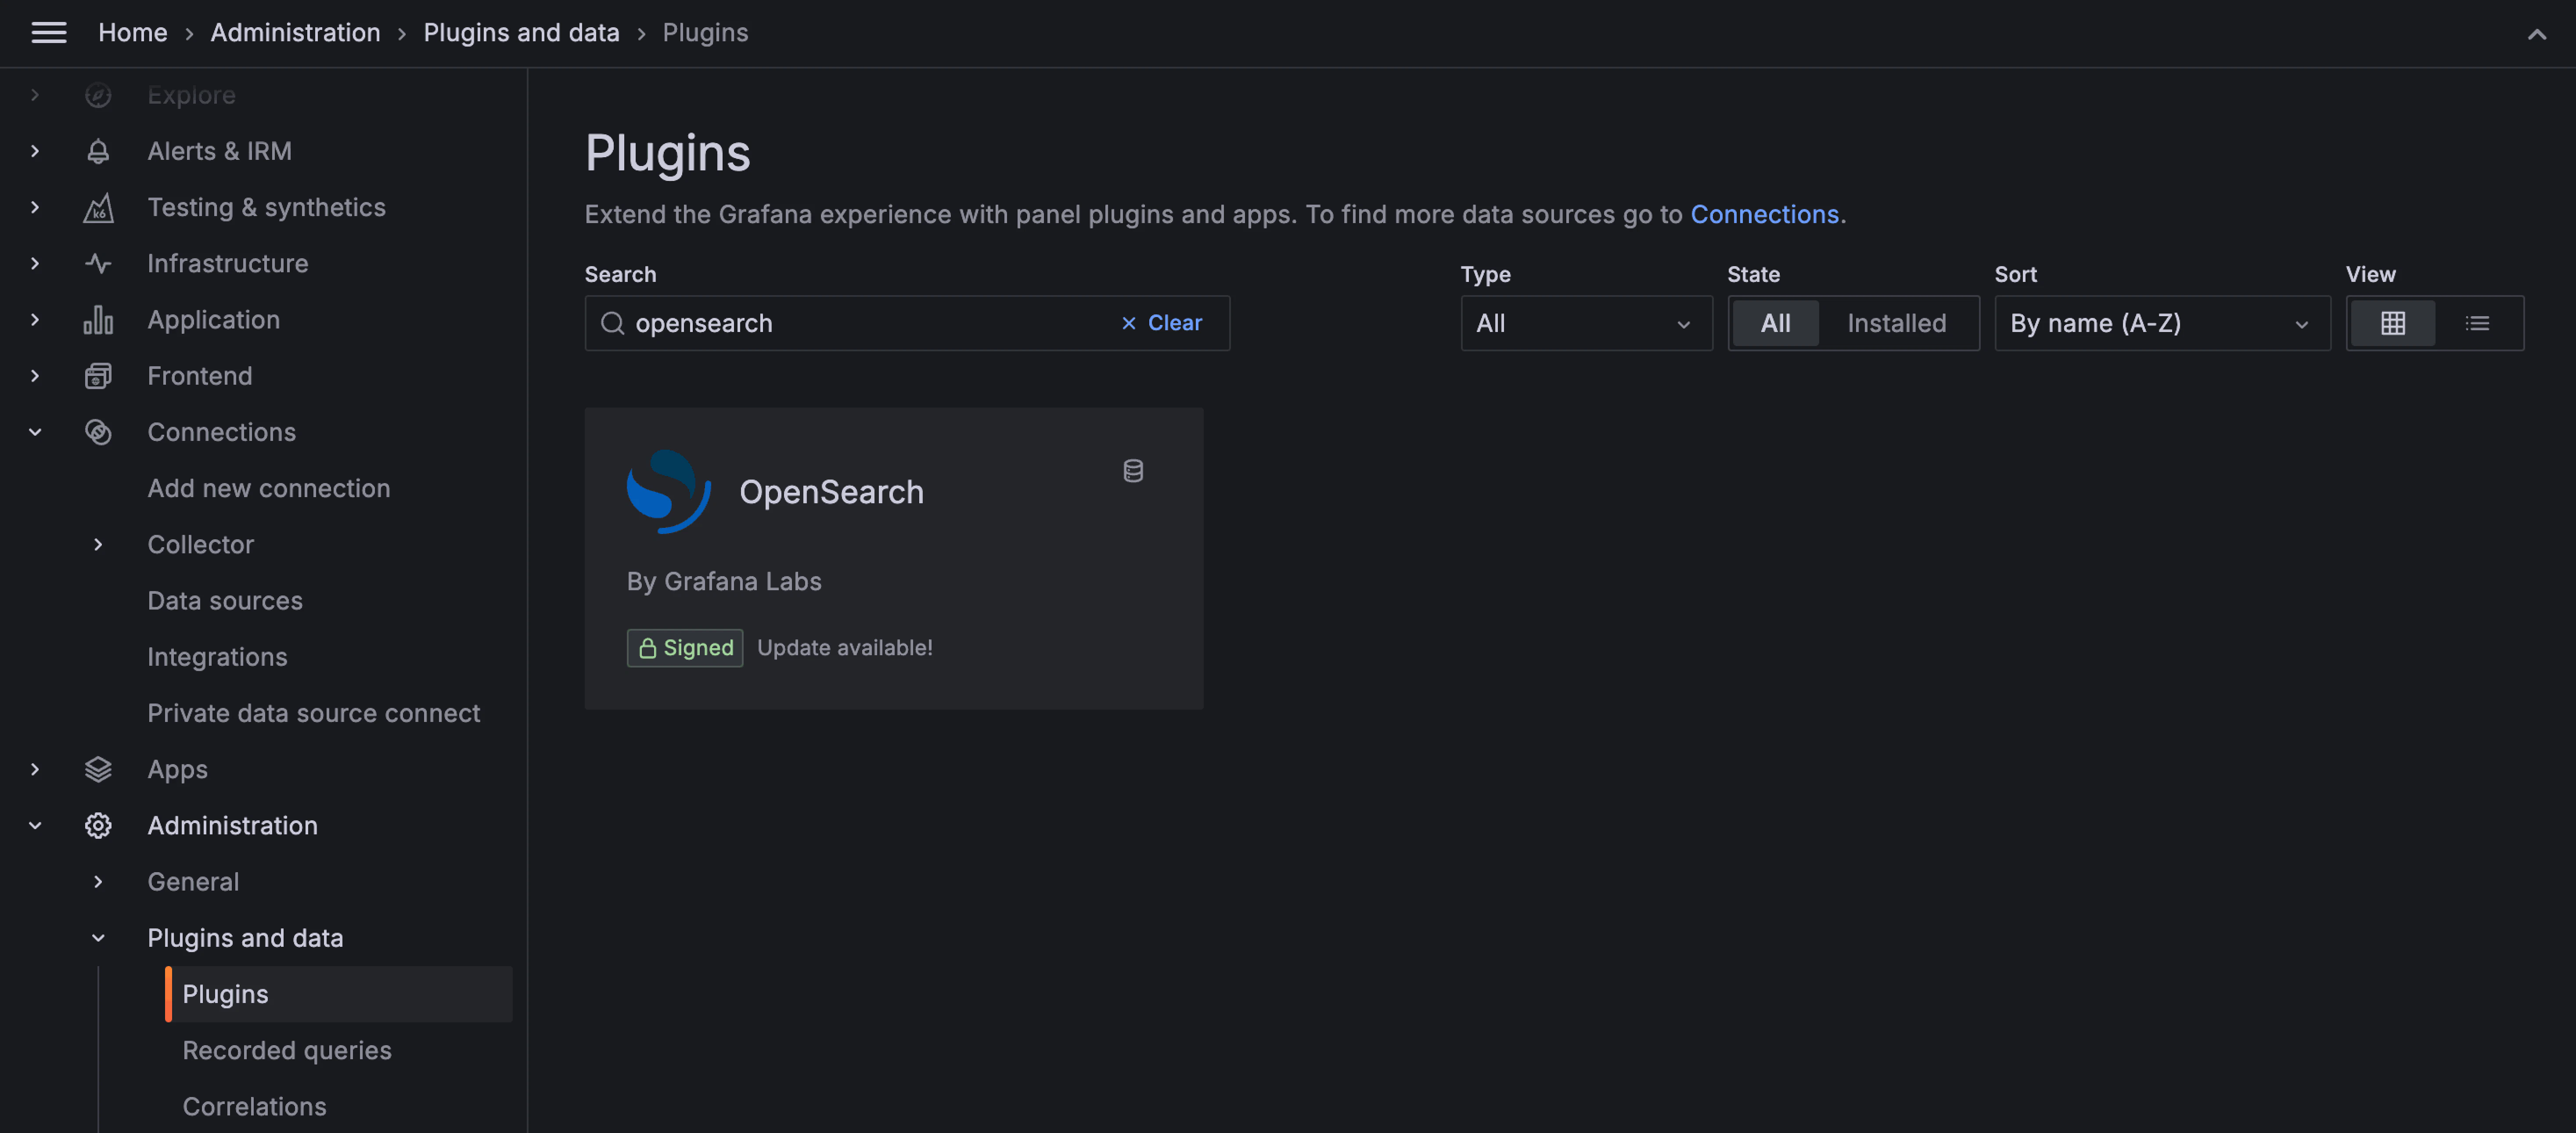
1\. In Grafana, navigate to the **Administration** section and click **Plugins**.
2\. Search for the OpenSearch plugin. In the **State** dropdown, check that **All** is selected. Otherwise, you won't see the plugin in search results.
3\. Click **Install**.
 The installation may take a few minutes.
## Step 3. Configure the OpenSearch plugin to display logs in Grafana
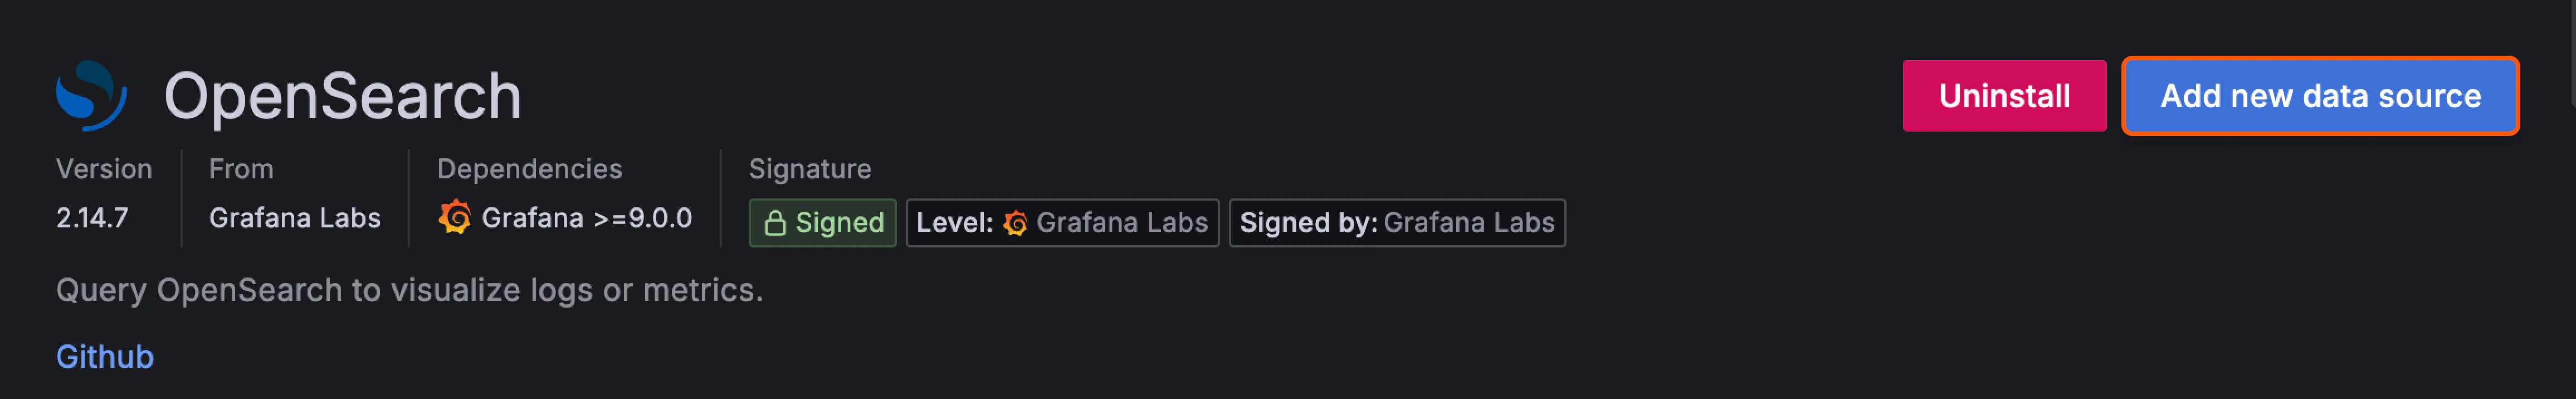
1\. Open the plugin in Grafana.
2\. In the top-right corner of the screen, click **Add new data source**.
The installation may take a few minutes.
## Step 3. Configure the OpenSearch plugin to display logs in Grafana
1\. Open the plugin in Grafana.
2\. In the top-right corner of the screen, click **Add new data source**.
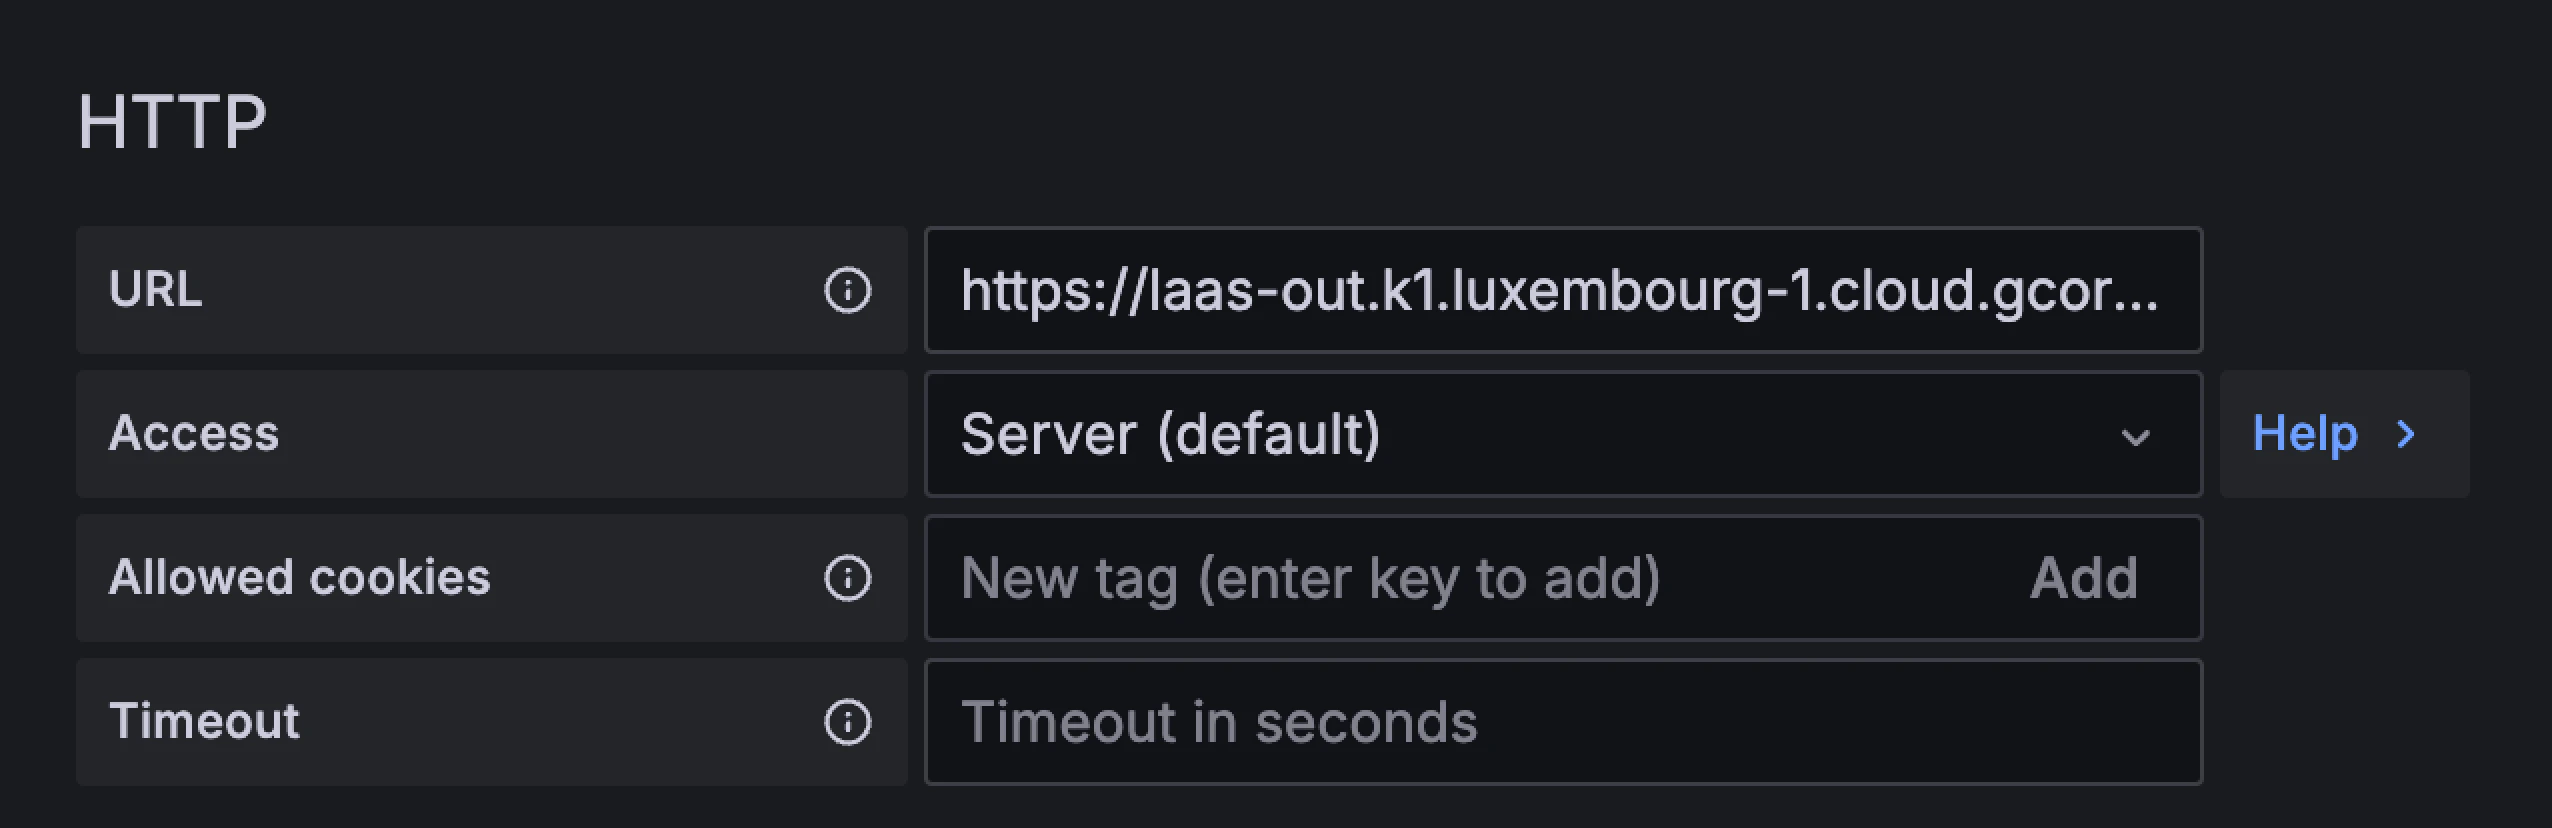
 3\. Configure the HTTP parameters:
* **URL** : Enter the link of OpenSearch API endpoint. You can find the link in the Gcore Customer Portal on the **Logging** page.
* **Access** : If you select "Server (default)", the URL will be accessible from the Grafana backend/server. If you choose "Browser", the URL will be accessible from the browser.
* **Allowed cookies** : Specify which cookies are allowed to be included in requests to the OpenSearch endpoint.
* **Timeout** : Set the maximum waiting time for a response from OpenSearch. This will determine how long Grafana will wait for a response before terminating the connection.
3\. Configure the HTTP parameters:
* **URL** : Enter the link of OpenSearch API endpoint. You can find the link in the Gcore Customer Portal on the **Logging** page.
* **Access** : If you select "Server (default)", the URL will be accessible from the Grafana backend/server. If you choose "Browser", the URL will be accessible from the browser.
* **Allowed cookies** : Specify which cookies are allowed to be included in requests to the OpenSearch endpoint.
* **Timeout** : Set the maximum waiting time for a response from OpenSearch. This will determine how long Grafana will wait for a response before terminating the connection.
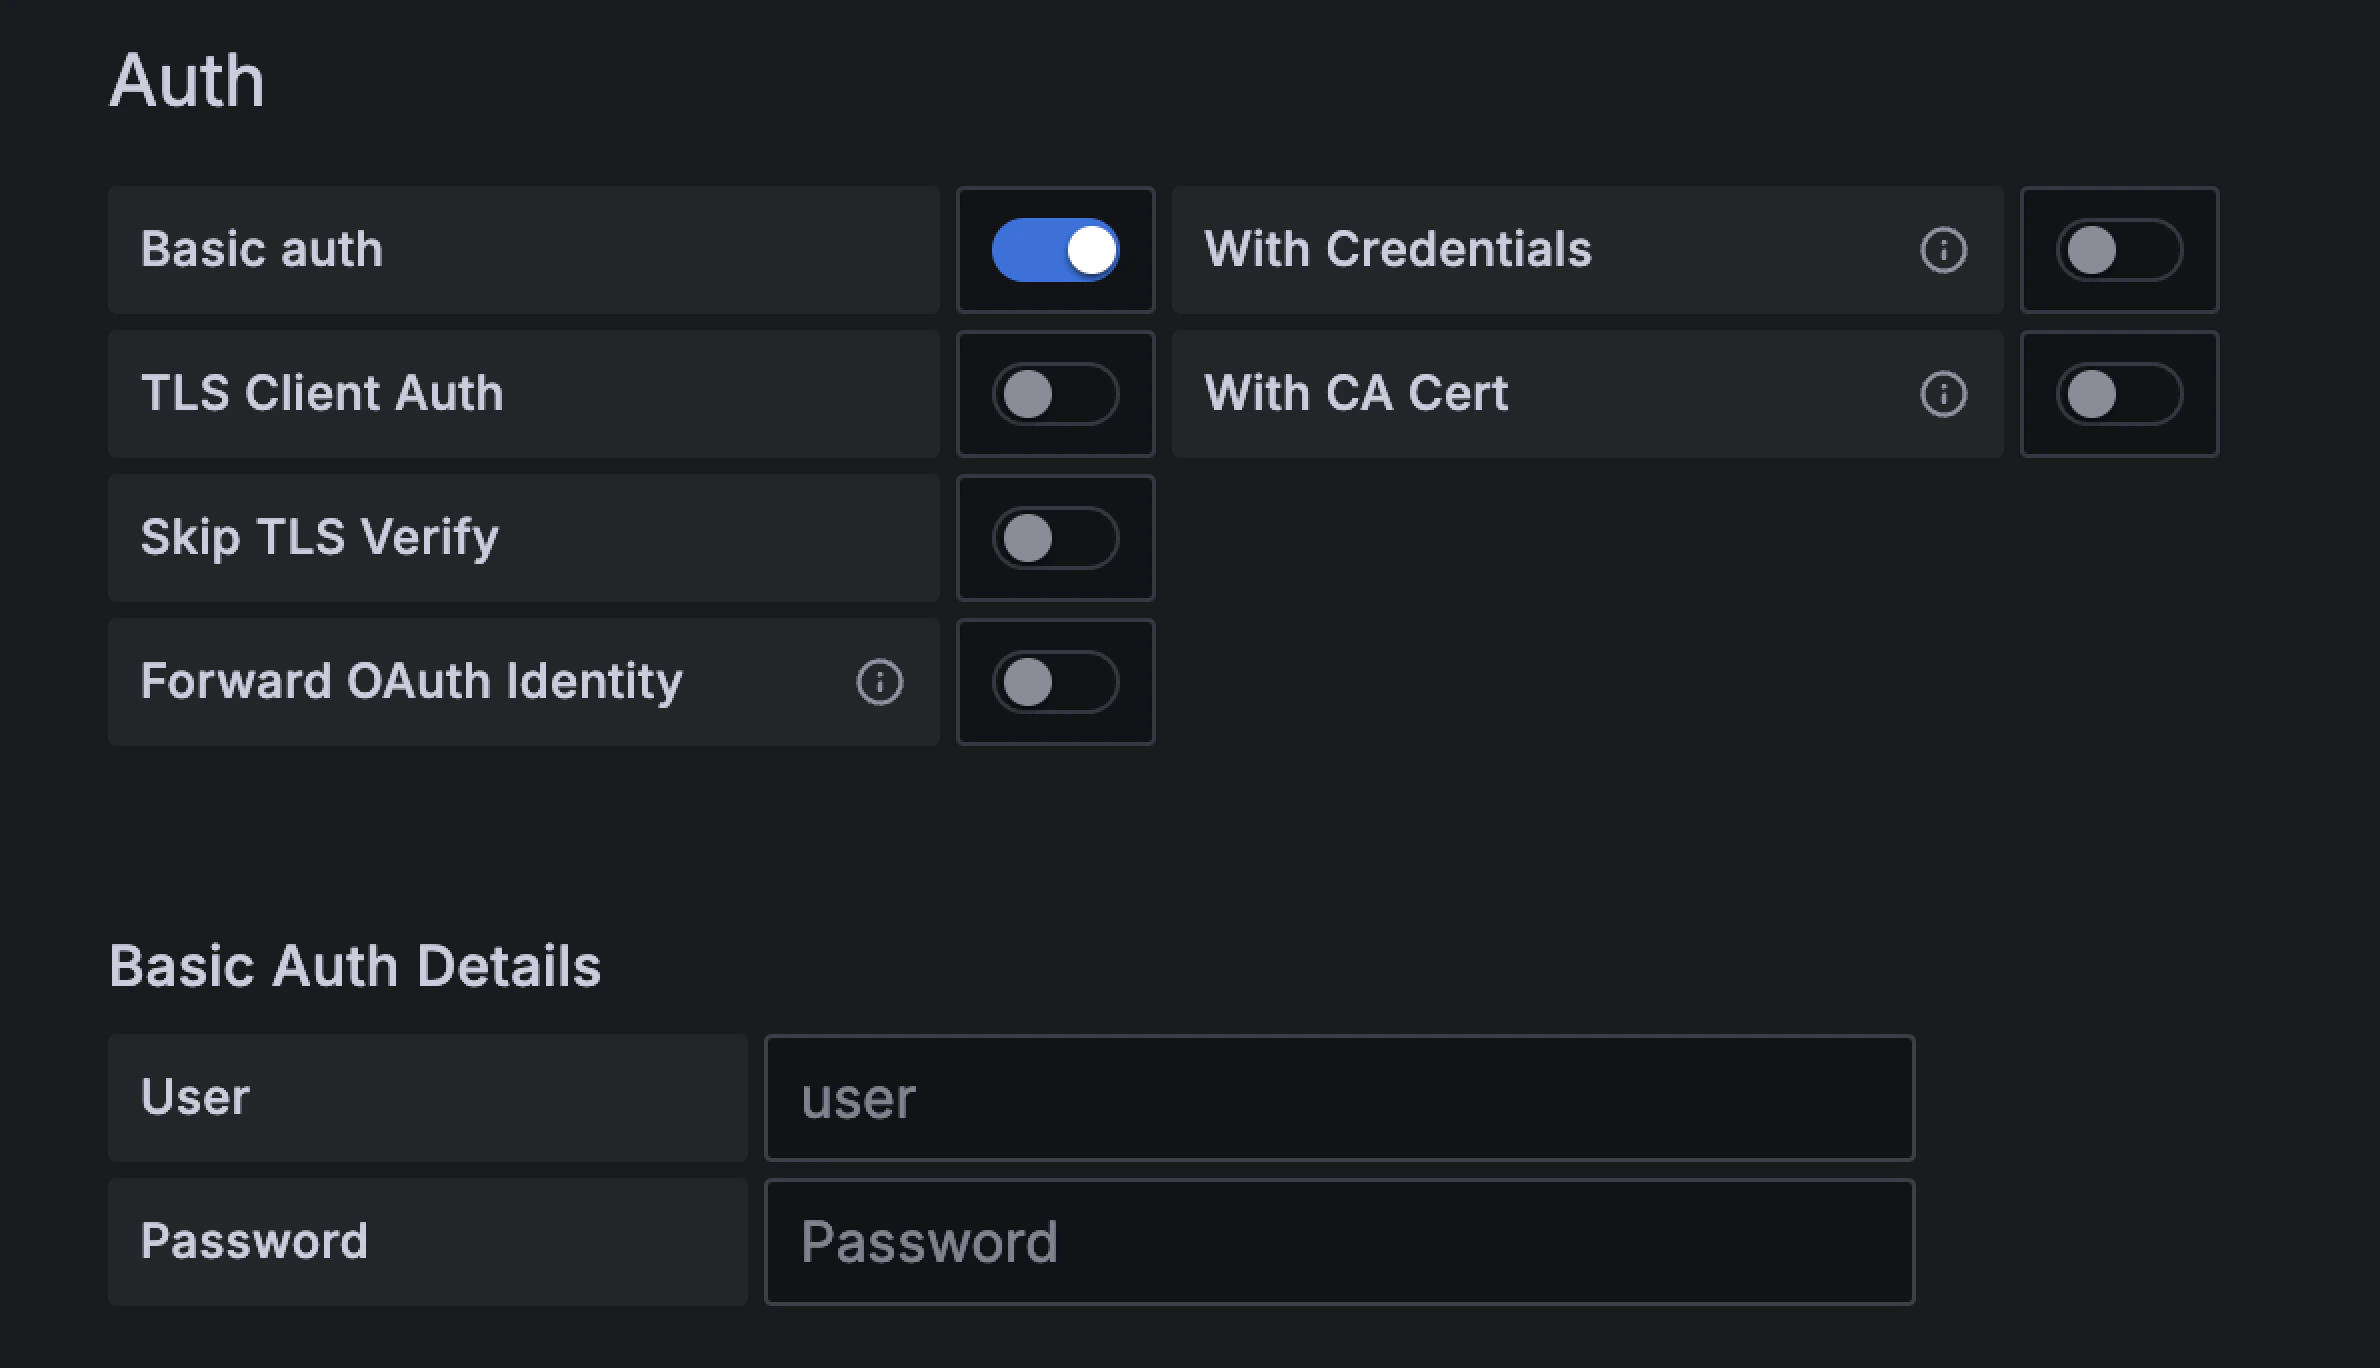
 4\. Configure authentication. Select **Basic auth** and use the credentials you configured on the **Logging** page in the Gcore Customer Portal.
 **Info**
After you select "Basic auth", you might see the following error: "OpenSearch error: no permissions for \[indices:admin/mappings/get] and User \[name=test2, backend\_roles=\[], requestedTenant=null]".
This error doesn't affect the plugin. Ignore it and proceed with the next steps.
5\. Click **Save & test** to save the configuration.
## Step 3. View your logs in Grafana
The following instructions explain how to create a new dashboard in Grafana and use it to display your log data. You can find detailed instructions on how to use and manage dashboards in the [official Grafana guide](https://grafana.com/docs/grafana/latest/dashboards/).
To display logs on a new Grafana dashboard:
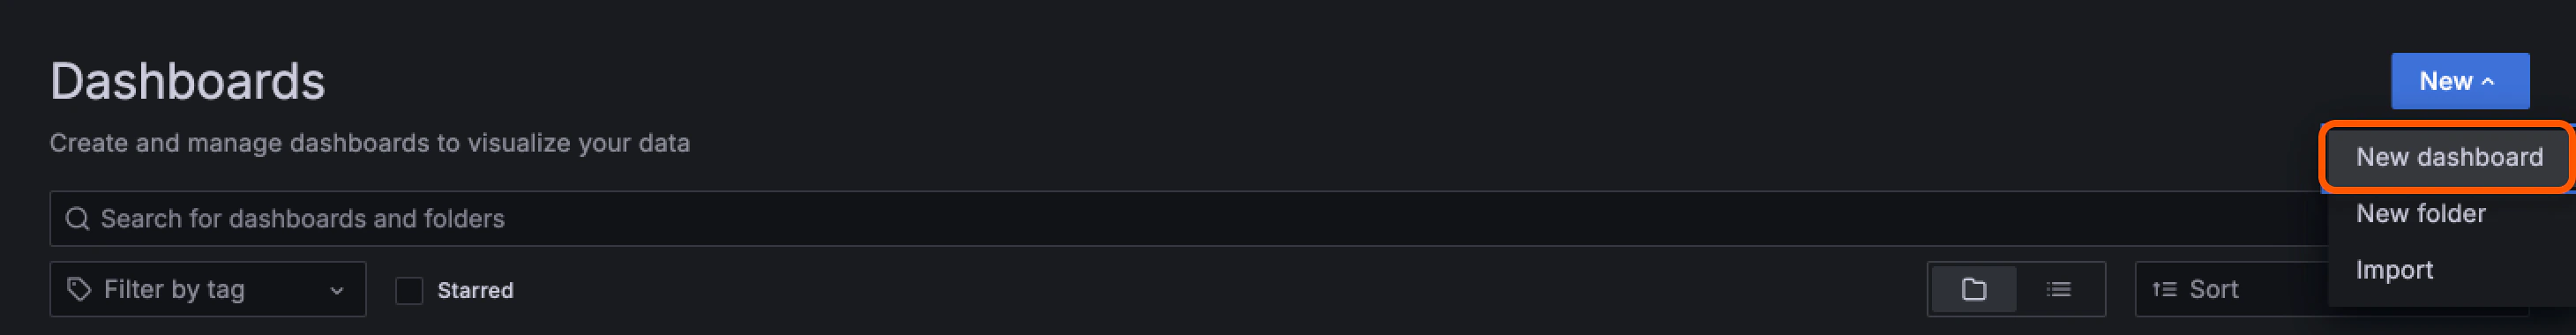
1\. In the sidebar, click **Dashboards**.
2\. In the top-right corner of the screen, click **New** > **New dashboard**.
**Info**
After you select "Basic auth", you might see the following error: "OpenSearch error: no permissions for \[indices:admin/mappings/get] and User \[name=test2, backend\_roles=\[], requestedTenant=null]".
This error doesn't affect the plugin. Ignore it and proceed with the next steps.
5\. Click **Save & test** to save the configuration.
## Step 3. View your logs in Grafana
The following instructions explain how to create a new dashboard in Grafana and use it to display your log data. You can find detailed instructions on how to use and manage dashboards in the [official Grafana guide](https://grafana.com/docs/grafana/latest/dashboards/).
To display logs on a new Grafana dashboard:
1\. In the sidebar, click **Dashboards**.
2\. In the top-right corner of the screen, click **New** > **New dashboard**.
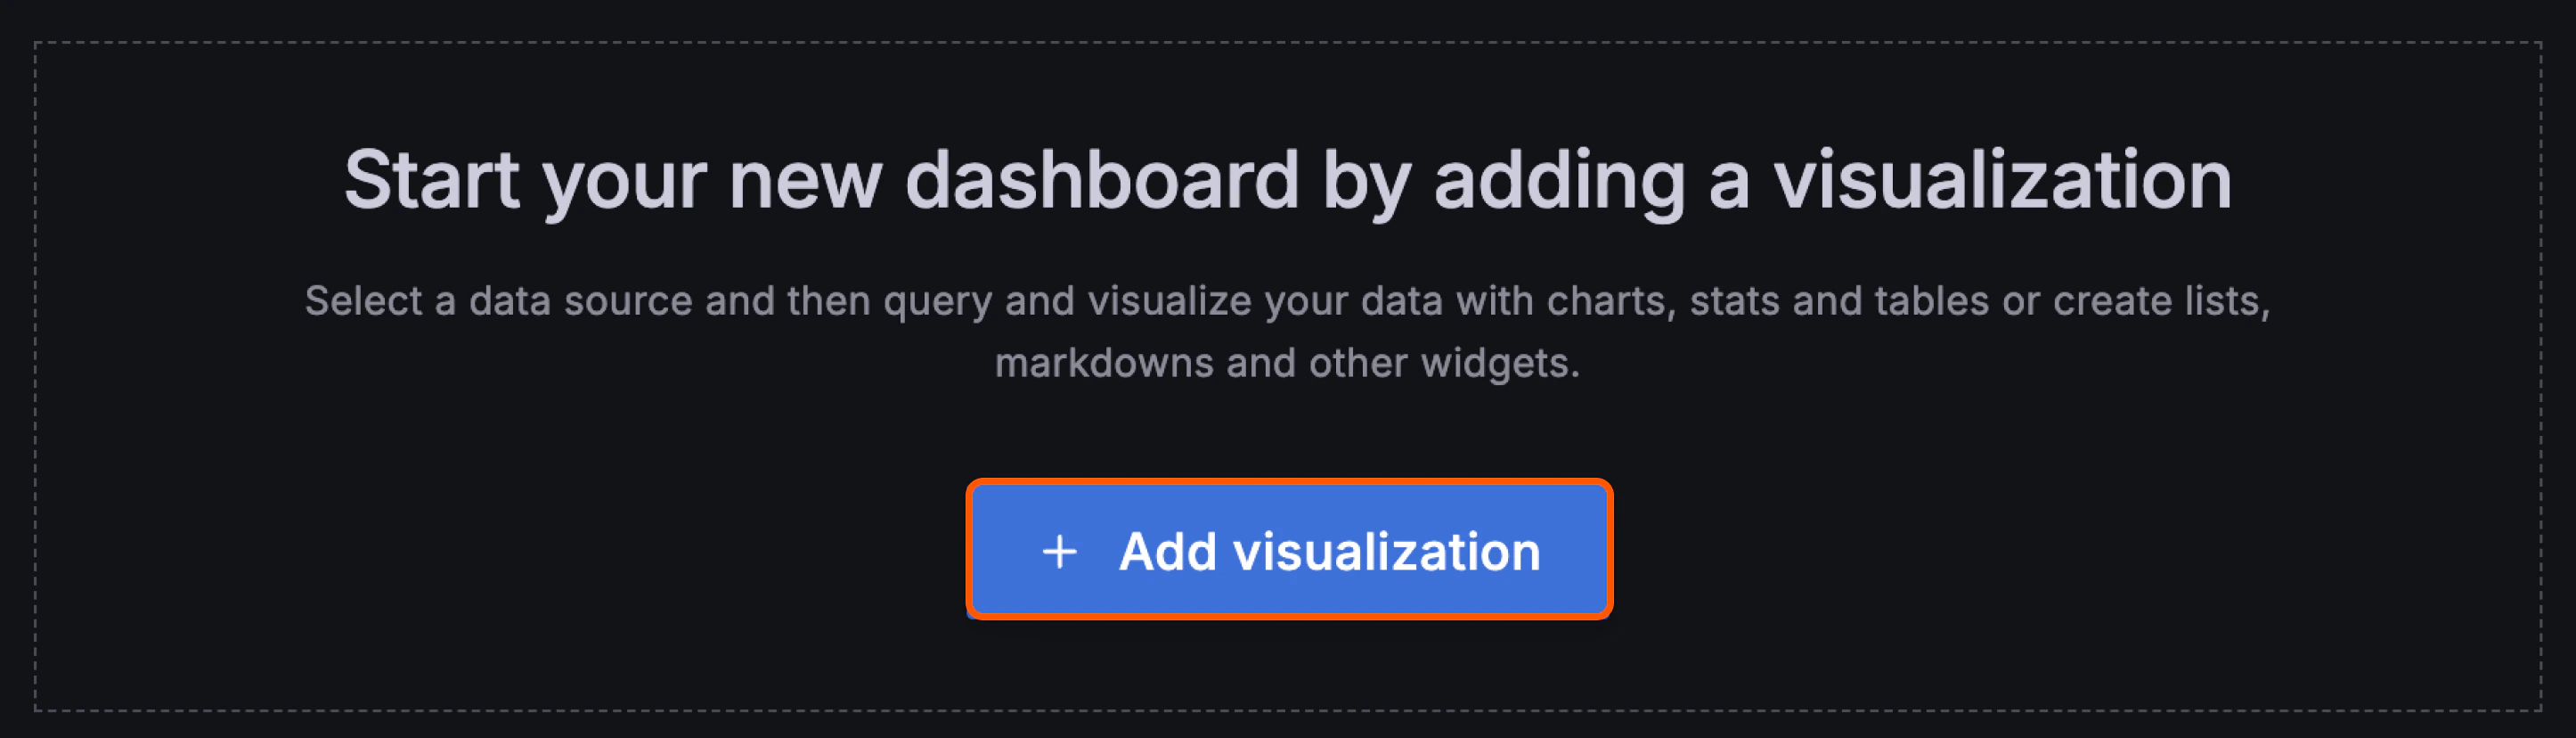
 3\. Click **Add visualization**.
 4\. Search for the **grafana-opensearch-datasource** plugin and click the plugin name to add data to the dashboard.
Your log data will appear on this new dashboard.
4\. Search for the **grafana-opensearch-datasource** plugin and click the plugin name to add data to the dashboard.
Your log data will appear on this new dashboard.