> ## Documentation Index
> Fetch the complete documentation index at: https://gcore.com/docs/llms.txt
> Use this file to discover all available pages before exploring further.

# DDoS events log

The DDoS events log inform you about ongoing attacks and create an archive for retrospective analysis. They enable you to enhance your overall security posture by reviewing past incidents in depth, identifying trends, and strengthening your defences accordingly.

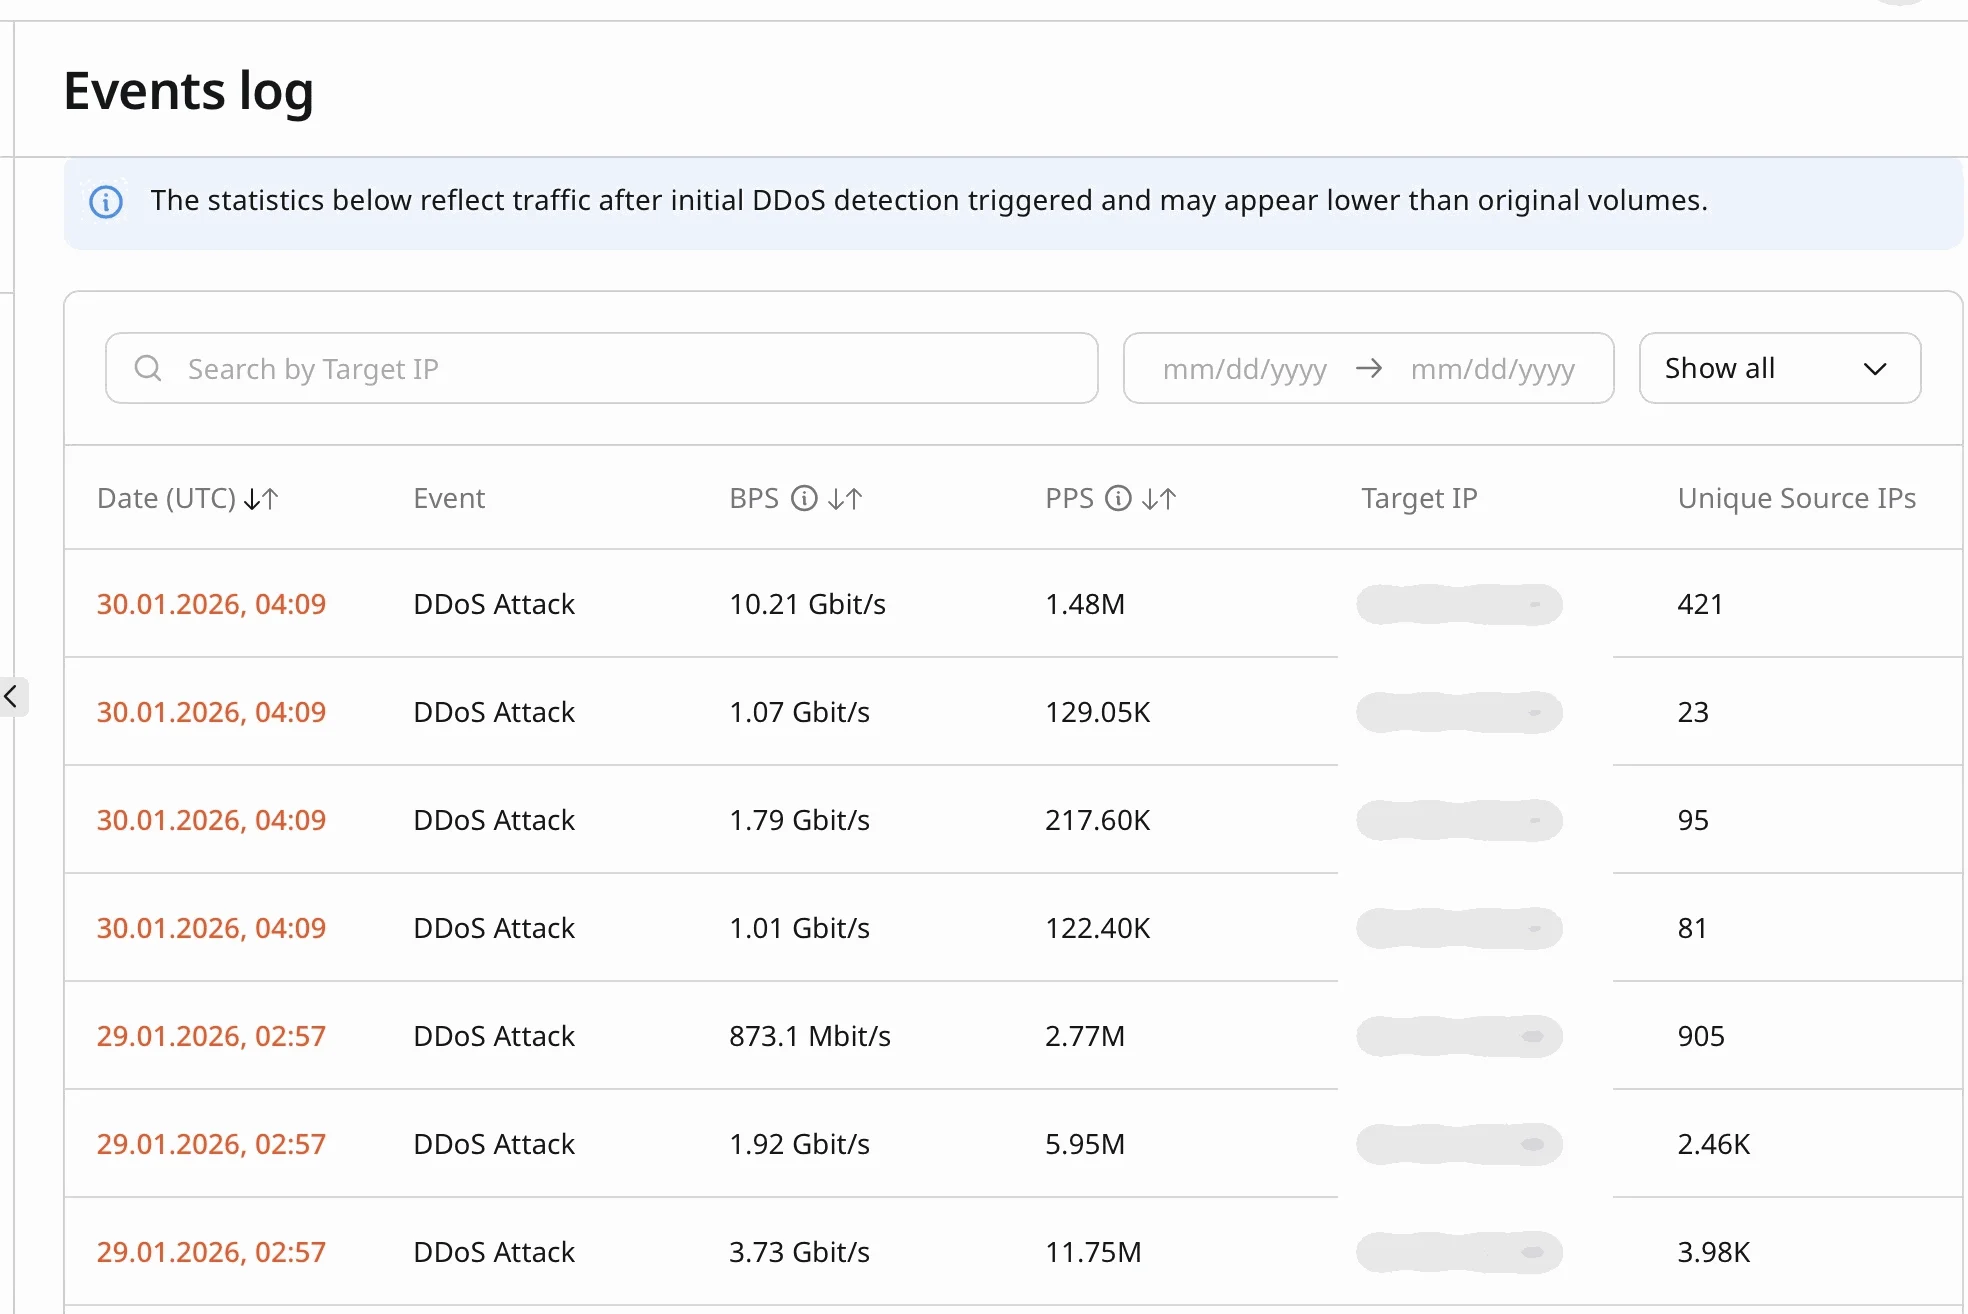
The Events Log provide details about **DDoS attacks of the past three months** and contain the following crucial information about each attack:

* Start date and time
* Bits per second (BPS)
* Packets per second (PPS)
* Attacked IP address
* Number of attacking IP addresses

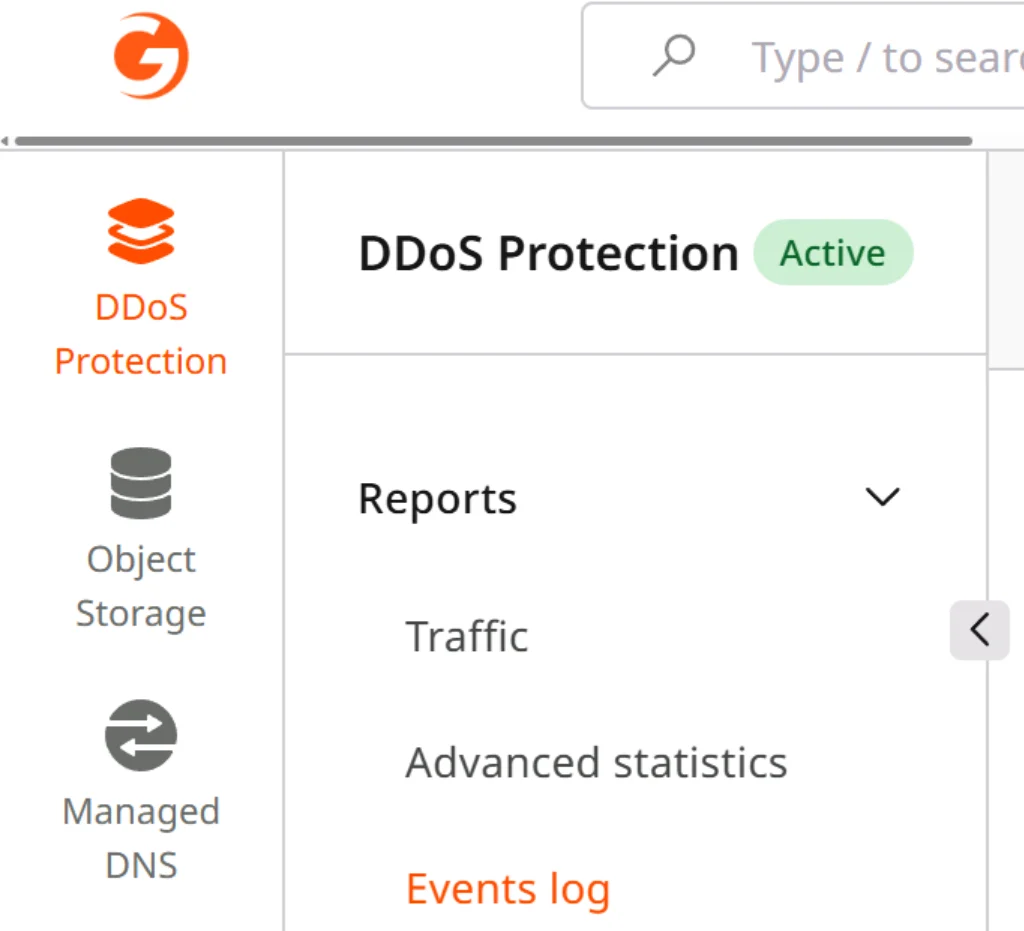
## View the DDoS events log

To view the events log, open the **Gcore Customer Portal** and navigate to **DDoS Protection > Reports > Events log**.

<Frame>
  <img src="https://mintcdn.com/gcore/Nyuci9EEwjnGjSHi/images/docs/ddos-protection/onboarding-service/custom-protection-profile-configuration/events-log-menu.png?fit=max&auto=format&n=Nyuci9EEwjnGjSHi&q=85&s=8b9e128f29798ae3c581430c5fbbe07a" alt="Gcore Customer Portal navigation" width="1024" height="931" data-path="images/docs/ddos-protection/onboarding-service/custom-protection-profile-configuration/events-log-menu.png" />
</Frame>

This example demonstrates how Events log data is displayed:

<Frame>
  <img src="https://mintcdn.com/gcore/Nyuci9EEwjnGjSHi/images/docs/ddos-protection/onboarding-service/custom-protection-profile-configuration/events-log-example.png?fit=max&auto=format&n=Nyuci9EEwjnGjSHi&q=85&s=a3ddb1d2345283180b74737acf1dacae" alt="Example DDoS events log table" width="1968" height="1314" data-path="images/docs/ddos-protection/onboarding-service/custom-protection-profile-configuration/events-log-example.png" />
</Frame>

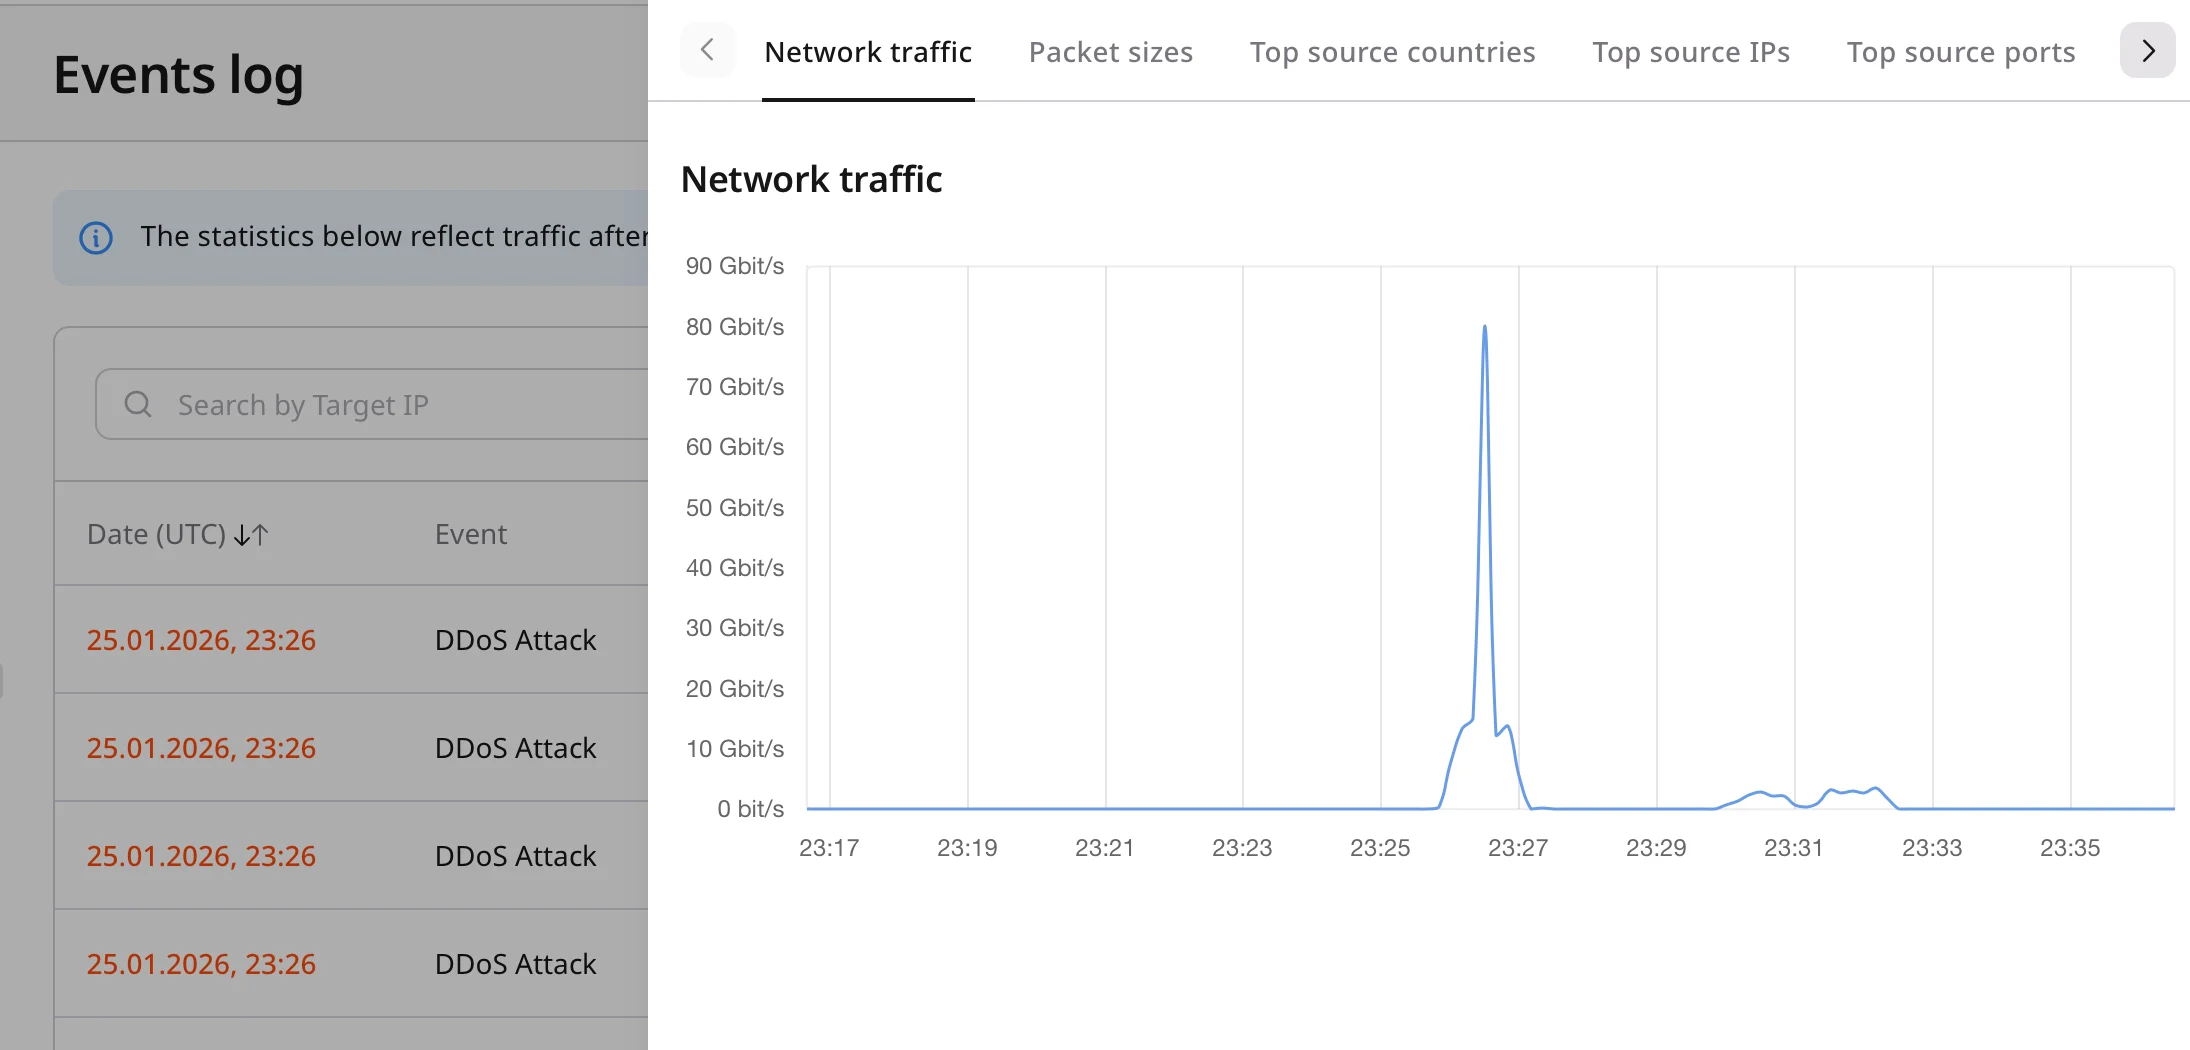
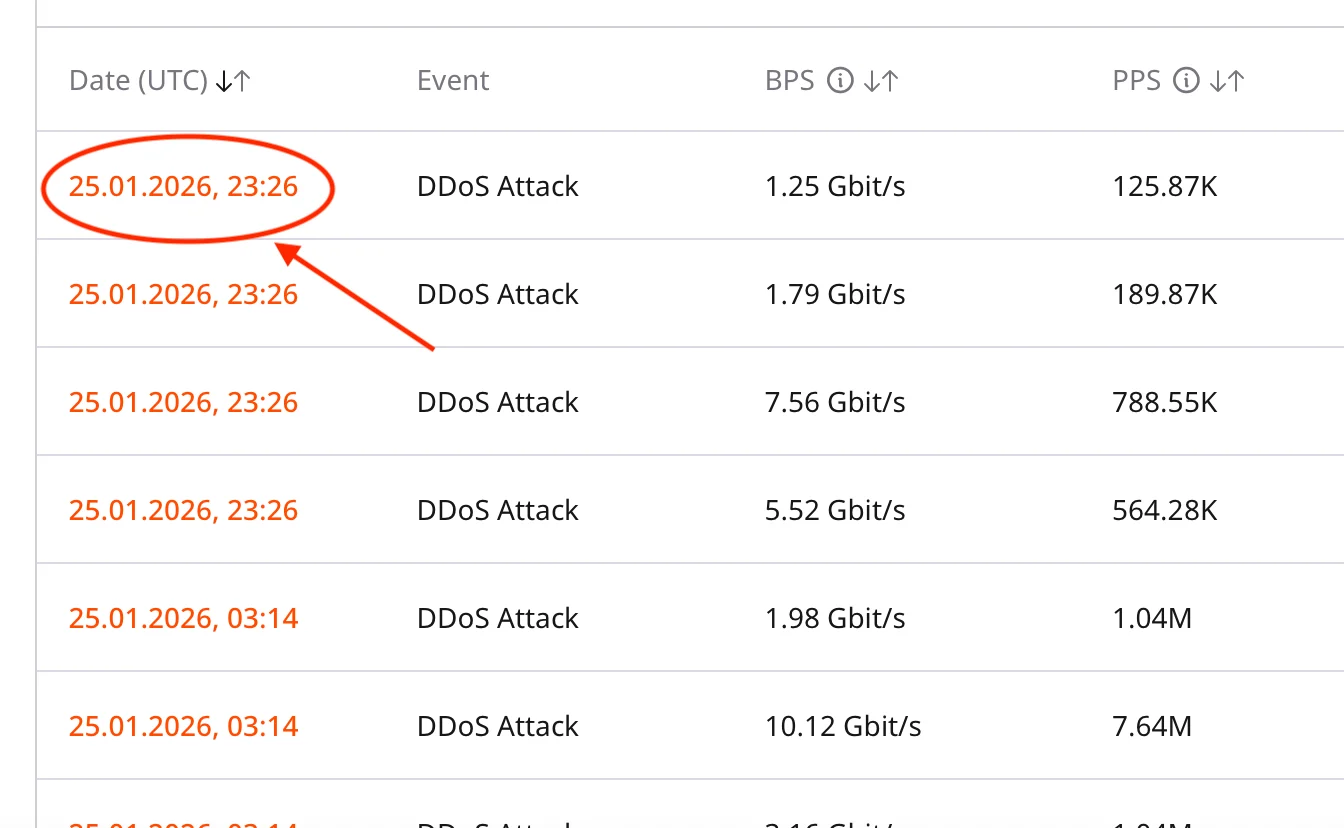
For more information about an event, click on its Date field.

<Frame>
  <img src="https://mintcdn.com/gcore/Nyuci9EEwjnGjSHi/images/docs/ddos-protection/onboarding-service/custom-protection-profile-configuration/events-log-more-details-1.png?fit=max&auto=format&n=Nyuci9EEwjnGjSHi&q=85&s=a8c821f0466d3d8814ae21fdced2c618" alt="More information for an event" width="1344" height="828" data-path="images/docs/ddos-protection/onboarding-service/custom-protection-profile-configuration/events-log-more-details-1.png" />
</Frame>

This opens a side bar with more detailed information.

<Frame>
  <img src="https://mintcdn.com/gcore/Nyuci9EEwjnGjSHi/images/docs/ddos-protection/onboarding-service/custom-protection-profile-configuration/events-log-more-details-2.png?fit=max&auto=format&n=Nyuci9EEwjnGjSHi&q=85&s=1d86defbdd530be4a2939d53836be07a" alt="Side bar for events log" width="2190" height="1050" data-path="images/docs/ddos-protection/onboarding-service/custom-protection-profile-configuration/events-log-more-details-2.png" />
</Frame>
