This is the second part of our series about Sysdig. Whereas our previous blog post focused on capturing data with the sysdig command-line utility, this tutorial will show how you can use Csysdig, the ncurses based GUI that ships with Sysdig. It’s worth mentioning that Csysdig goes beyond what most monitoring tools provide in terms of functionalities, by giving you the ability to perform various actions directly from its interface. As an example, you can start a shell inside of a container, display logs, kill a container and many more.
Prerequisites
As a prerequisite, we assume you followed our first tutorial on Sysdig. If so, both Sysdig and Csysdig should be installed on your system. Also, a capture file called monitoring-wordpress.scap should already exist.
Command-line Options
If you enter the csysdig command with the -h option, the list of command-line options is displayed as in the following output:
csysdig --helpcsysdig version 0.26.4Usage: csysdig [options] [filter]Options: -A, --print-ascii When emitting JSON, only print the text portion of data buffers, and echo end-of-lines. This is useful to only display human-readable data. -B<bpf_probe>, --bpf=<bpf_probe> Enable live capture using the specified BPF probe instead of the kernel module. The BPF probe can also be specified via the environment variable SYSDIG_BPF_PROBE. If <bpf_probe> is left empty, sysdig will try to load one from the sysdig-probe-loader script. --cri <path> Path to CRI socket for container metadata Use the specified socket to fetch data from a CRI-compatible runtime --cri-timeout <timeout_ms> Wait at most <timeout_ms> millisecondNote that the above output was truncated for brevity.
Let’s look at some of the most important flags:
-r. You can analyze an existing trace file by entering thecsysdigcommand followed by the-rflag and the name of the capture file:
csysdig -r monitoring-wordpress.scapThis will display the default view that lists the processes for the period in which the events were captured:

-d. If you don’t use the-rflag, then you can run Csysdig with the-dflag to specify the delay between updates, expressed in milliseconds.-pcontainer. Configures Csysdig to display data in a container-friendly format:
csysdig -r monitoring-wordpress.scap -pcontainer
☞ For the scope of this tutorial, you’ll use the capture file created in the previous tutorial – monitoring-wordpress.scap.
What is a View?
At first glance, the Csysdig interface looks similar to the one provided by tools such as htop. However, Csysdig is based on the concept of views, which offers a larger array of functionalities and makes it easily customizable.
Under the hood, a view is a Lua script that makes use of the Sysdig processing engine to determine how metrics are collected, processed, and displayed.
The views are usually placed in the /usr/share/sysdig/chisels and ~/.chisels directories.
Enter the following commands to display the list of views:
ls /usr/share/sysdig/chiselsCOPYING memcachelog.lua topcontainers_cpu.lua v_directories.lua v_procs_cpu.luaansiterminal.lua netlower.lua topcontainers_error.lua v_docker_events.lua v_procs_errors.luaaround.lua netstat.lua topcontainers_file.lua v_errors.lua v_procs_fd_usage.lu```Note that the above output was truncated for brevity.
You can also access the list of views from inside of Csysdig, by pressing the F2 key:

You will see the list of views and a detailed description of the highlighted view:

Use the arrow keys to navigate to a different view:
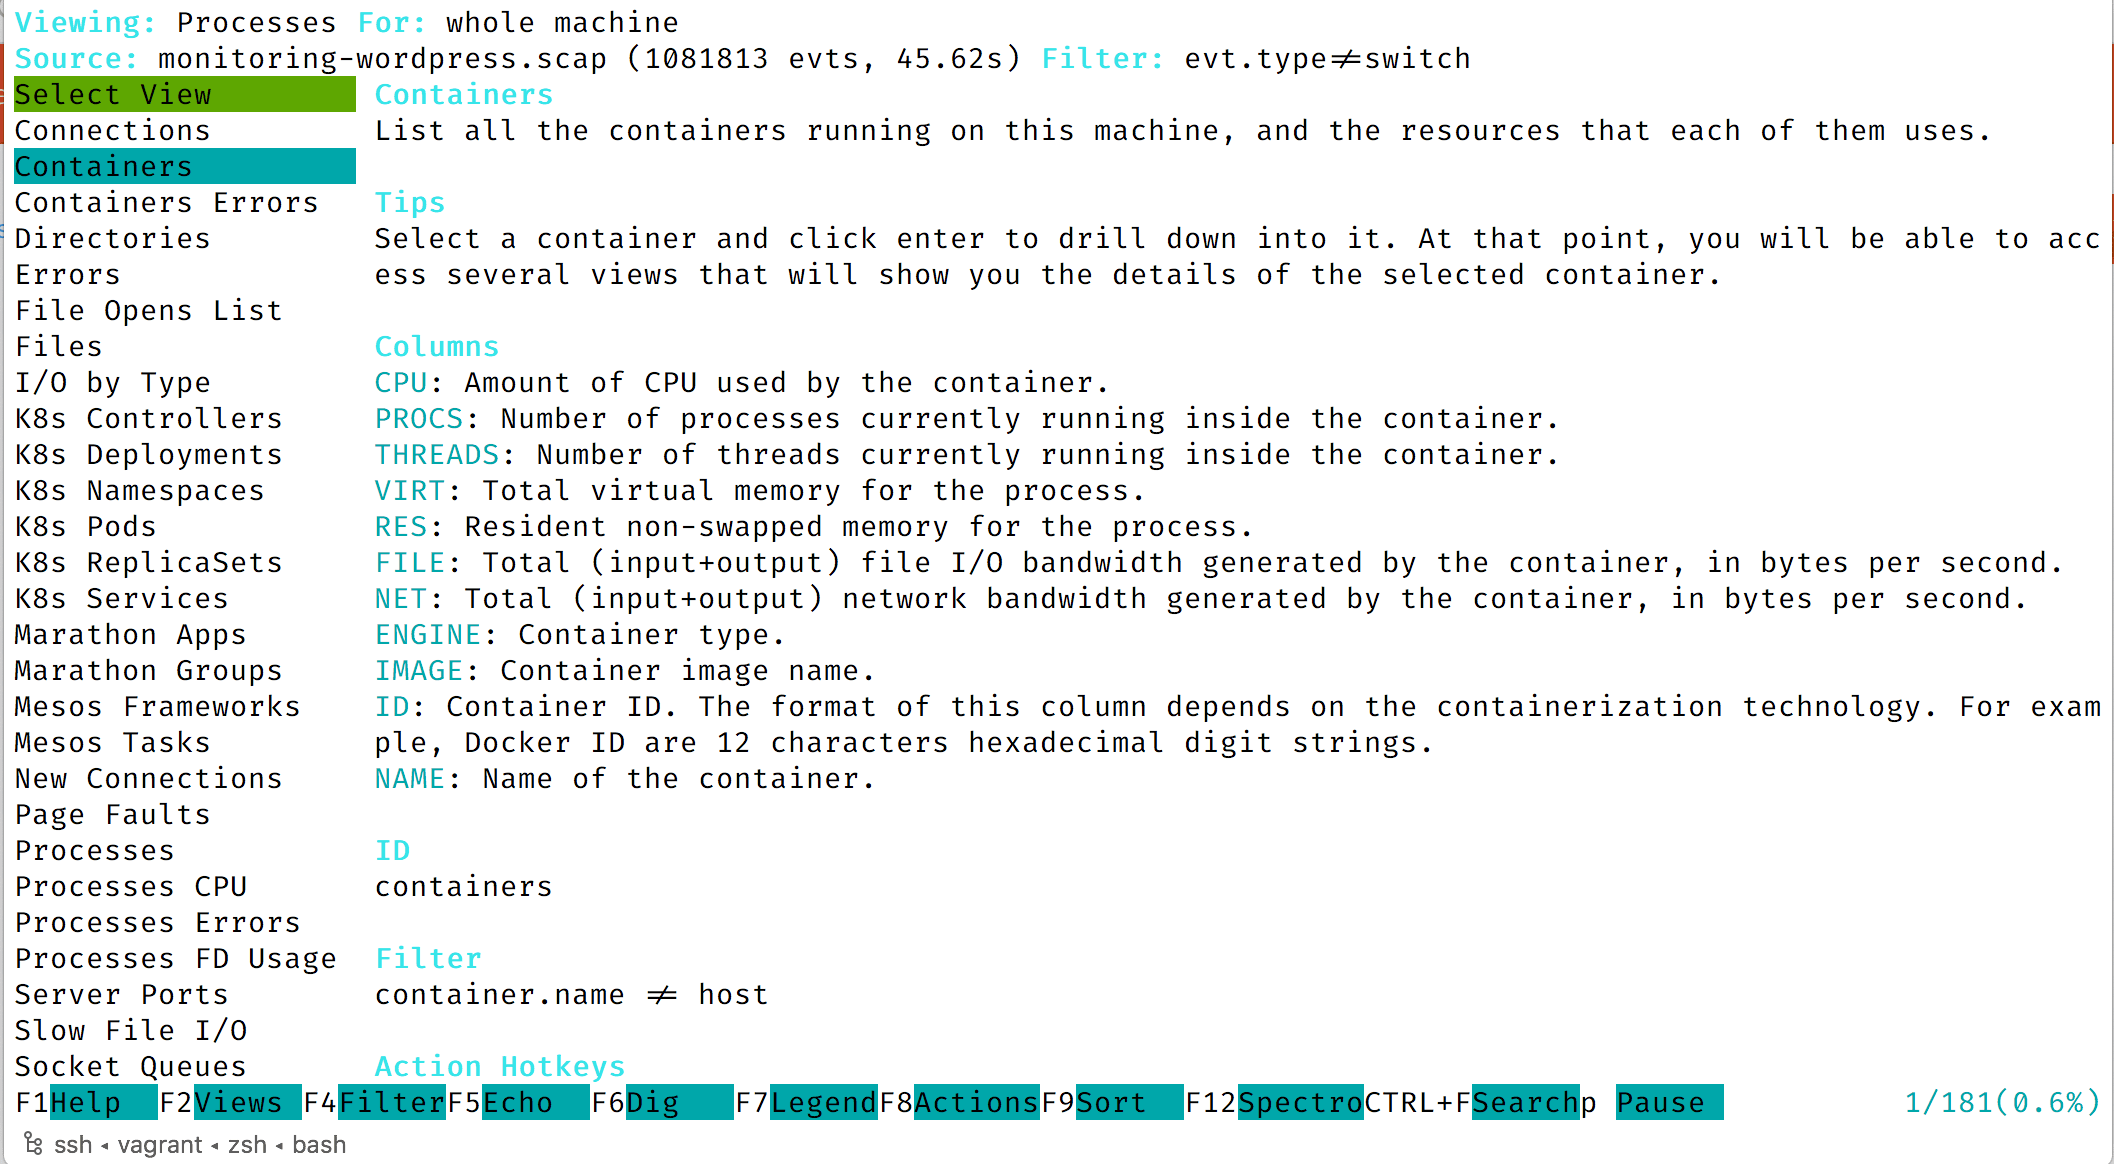
☞ When navigating through various Csysdig screens, keep in mind the following principles:
F2switches to a different viewEnterdrills down into the active selectionBackspacenavigates to the previous screen
The Containers View
Continuing with our example, we selected the Containers view and applied it with the Enter key:

This provides a brief overview of the three containers running on your machine. Next, you can follow these steps to get in-depth information:
- Navigate to the first container in the list and press the
Enterkey. You will be presented with the list of processes running in this container. At the top of the screen, Sysdig shows the list of active filters. This means you can retrieve the same information stringing these filters in the command-line.

- With Csysdig, you can dig even further. Select a process from the list and then press the
Enterkey again. This will display the list of threads for the selected process.
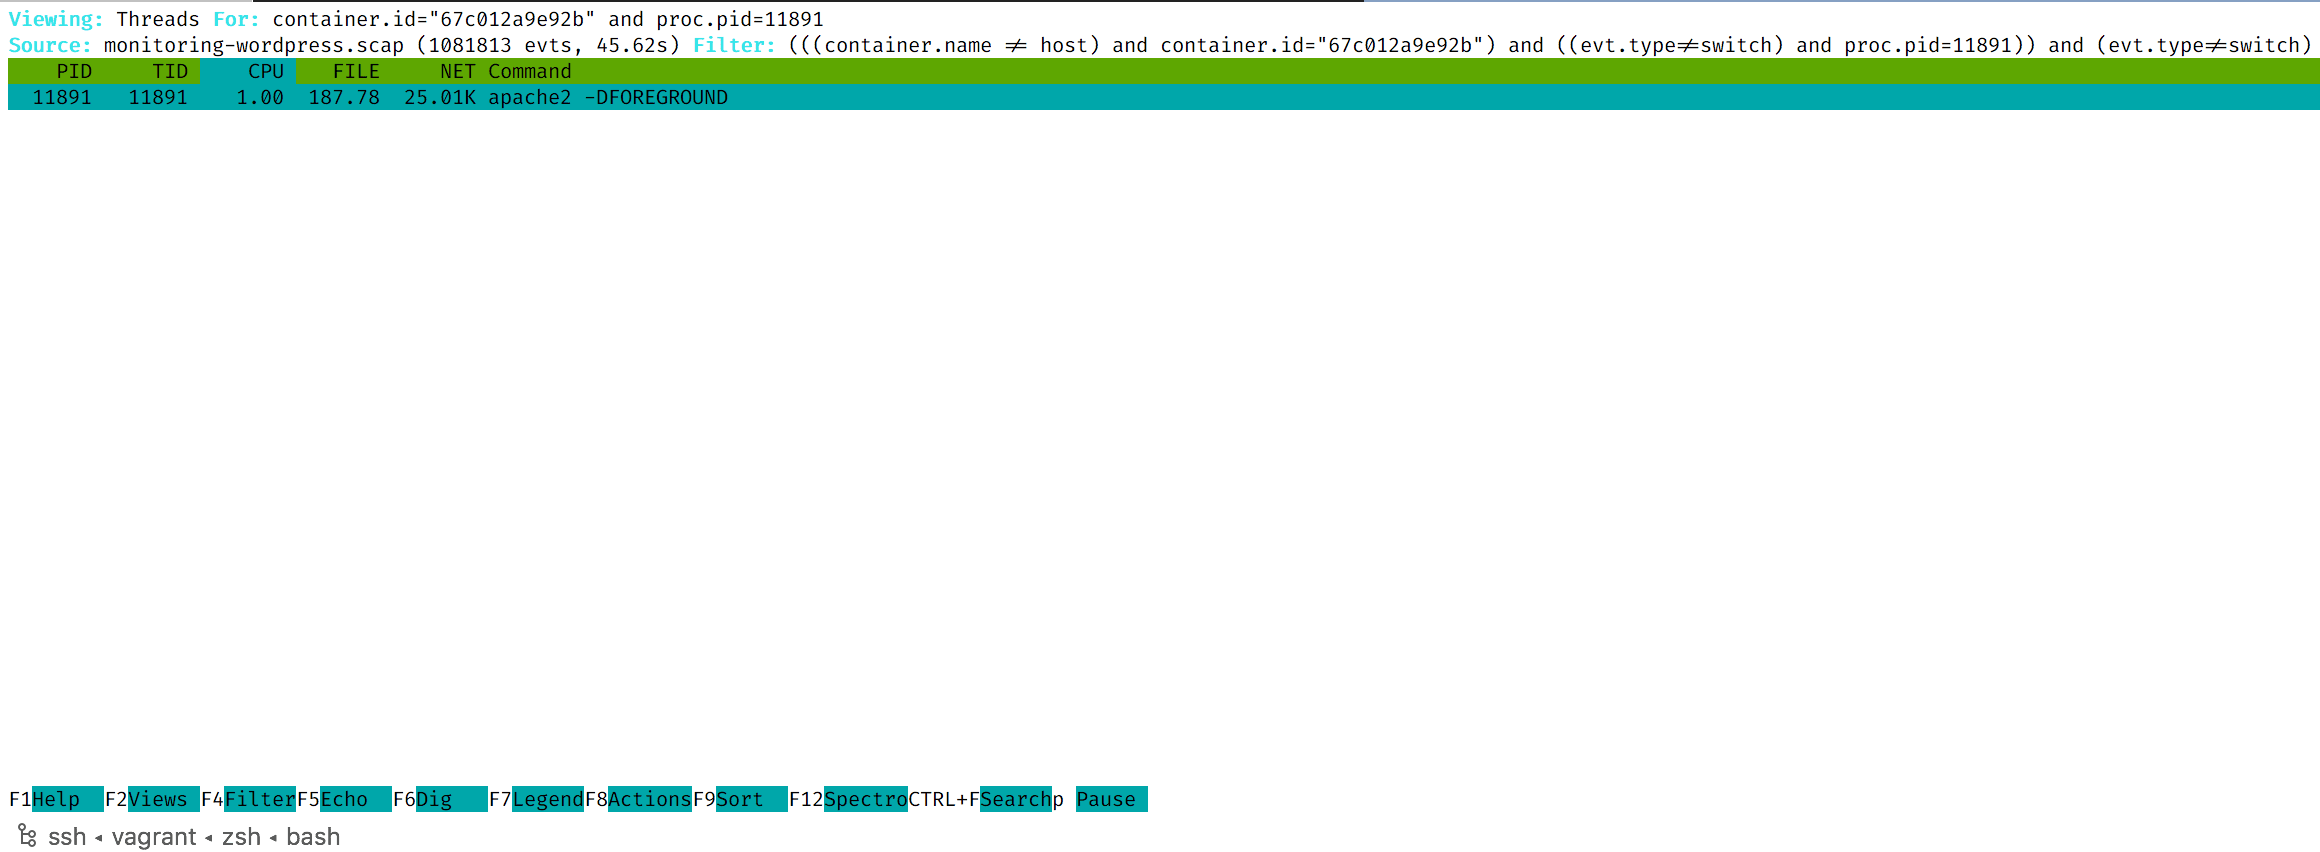
- From here, you have two options:
Option A: Press the Enter key
A.1 You will be presented with the list of files that were accessed by this thread during the period in which you captured events:

As you can see, the list of filters is getting pretty long. Imagine doing this without a GUI😉.
A.2 Csysdig allows you to retrieve even more detailed information. Select the .htaccess file and press the F5 key. This shows the inputs and the outputs for the selected file.

Option B: Press the F5 key
- B.1 This shows the I/O activity of the selected process.
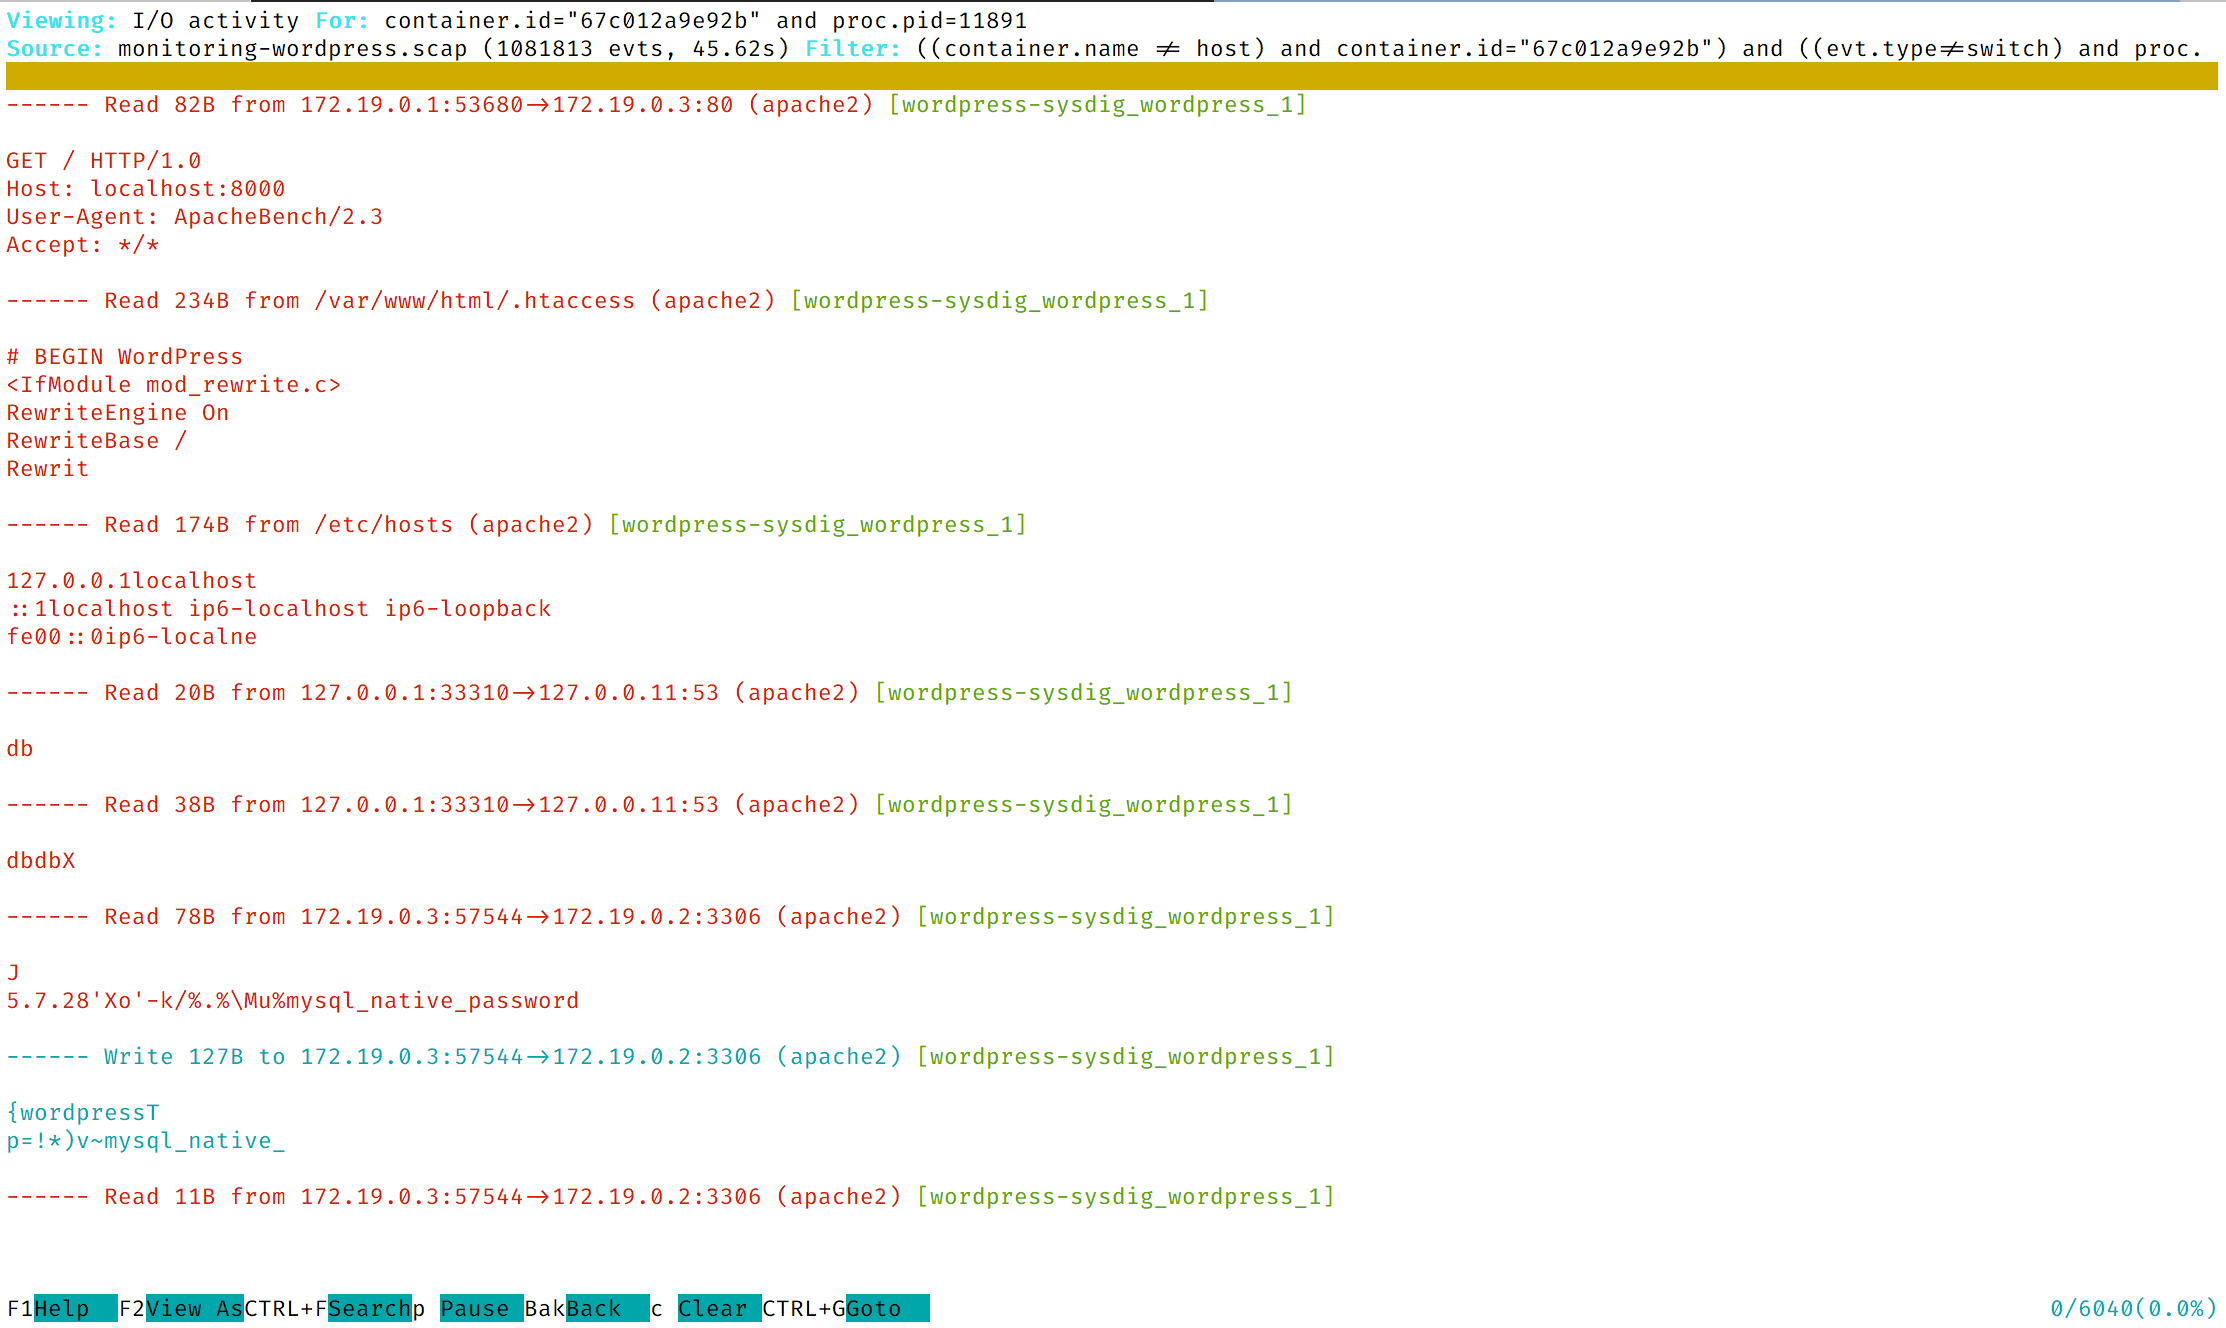
- B.2 If you press the
F2key, Csysdig allows you to select the format in which the data is formatted:
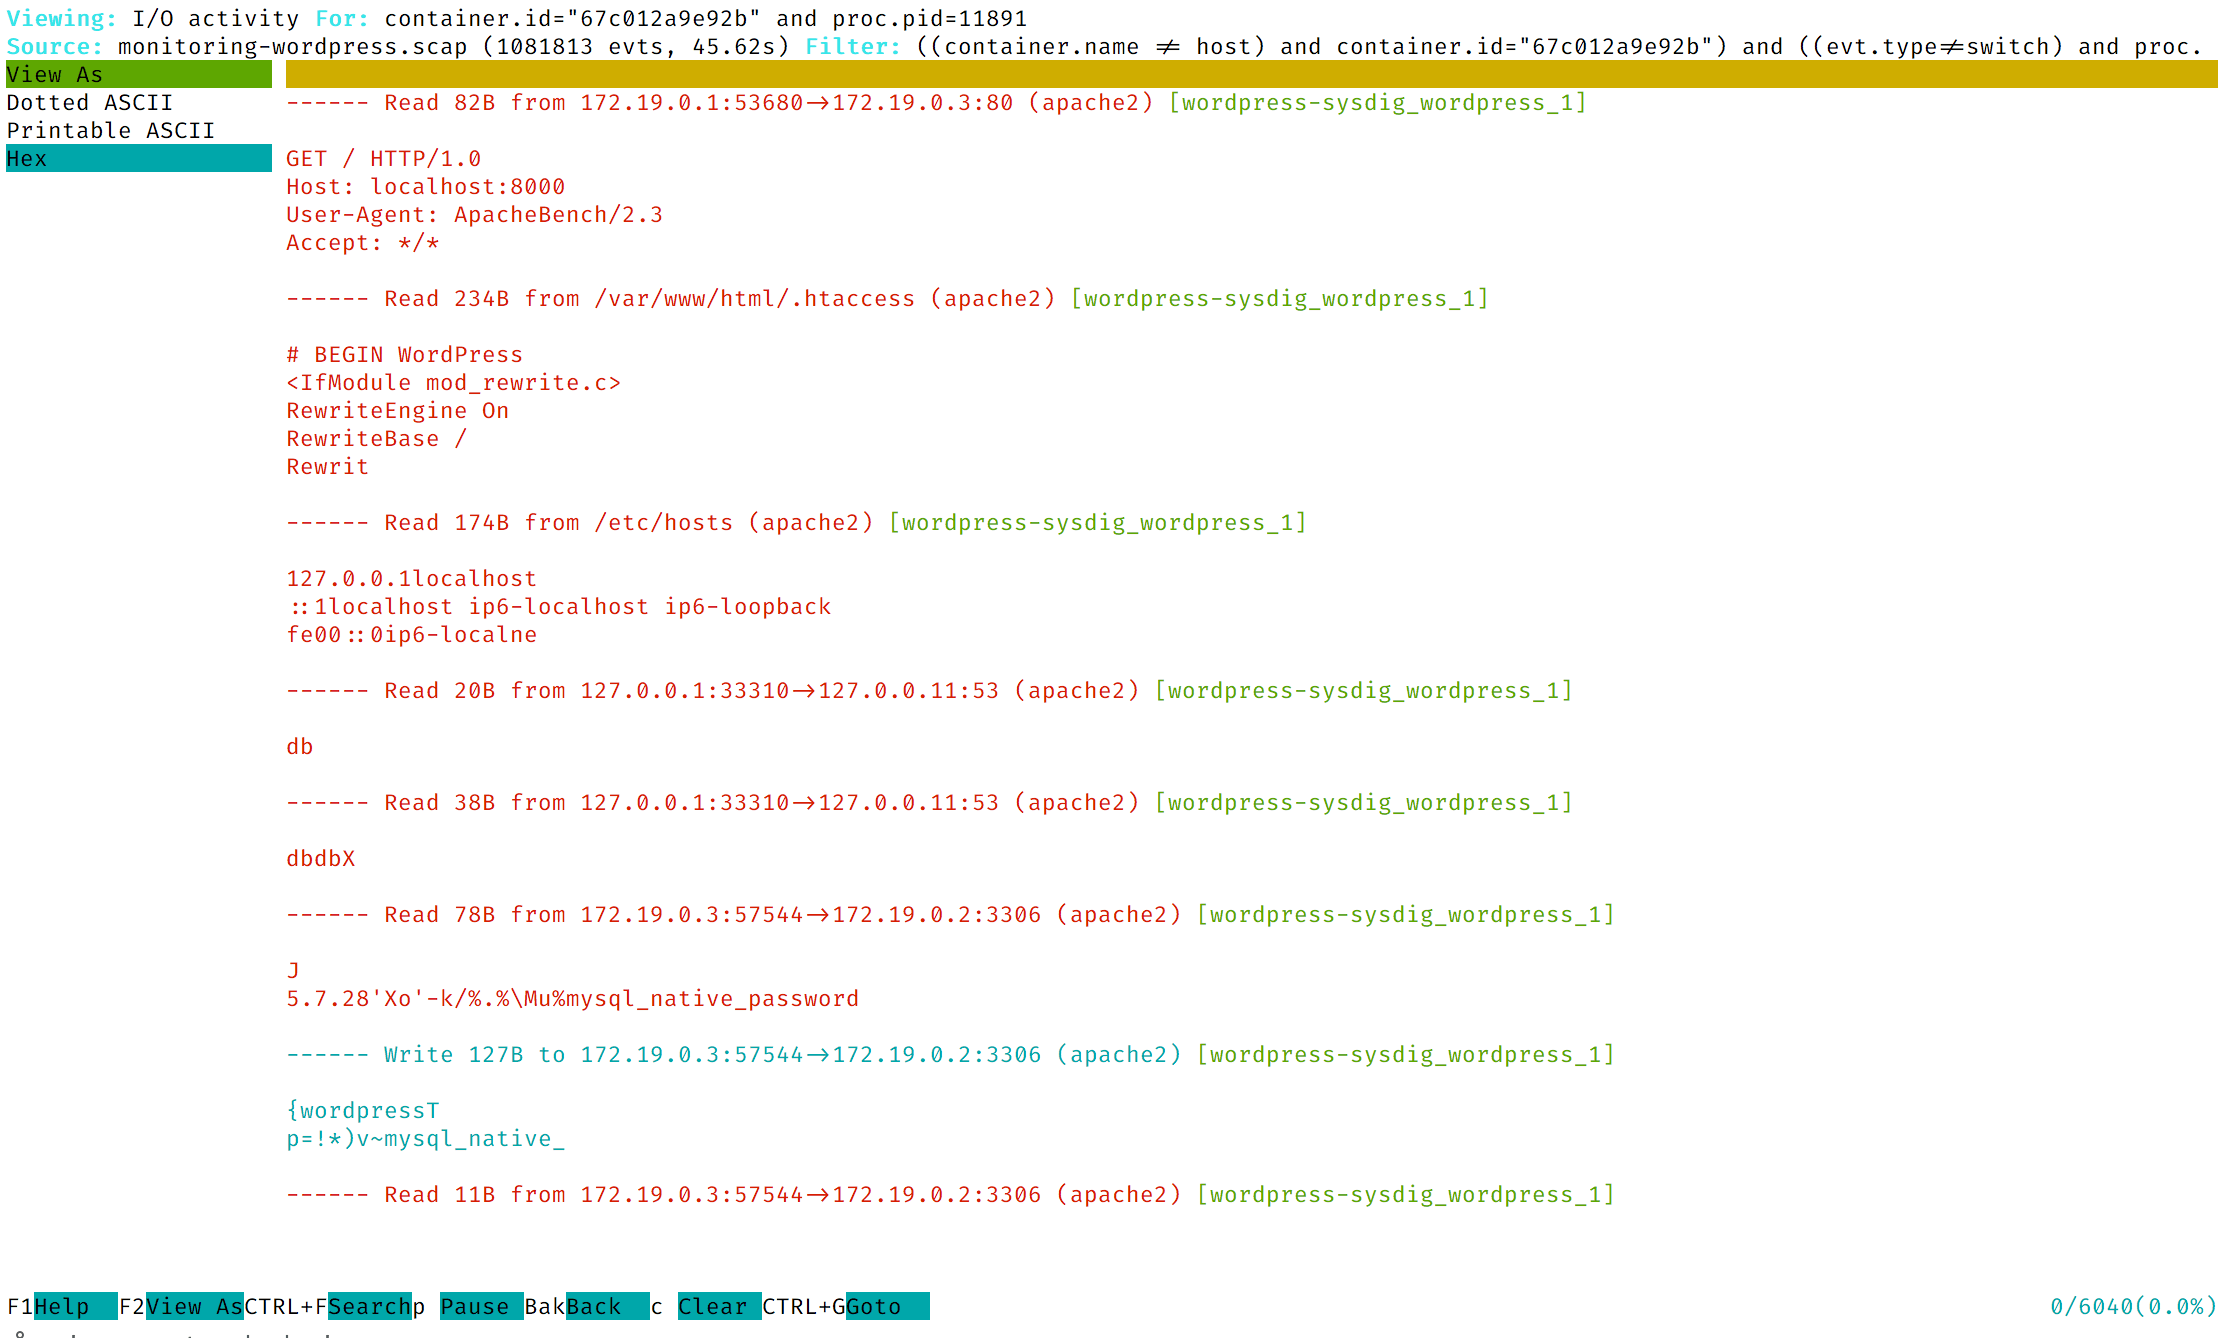
- B.3 Select
Printable ASCII. Then, you can use the arrow keys to navigate through this view:

The screenshot above shows the activity of the selected process. As you can see, it accepted an incoming connection initiated by ApacheBench, read from the .htaccess file and so on.
☞ Similarly to the Containers view, you can access any other view.
The Actions Panel
As mentioned, Csysdig lets you perform actions directly from its interface. In this section, we’ll look at some examples of you can use Csysdig’s actions panel.
The sysdig container is pretty barebones and, out of the box, it lacks the utilities needed to make the most of the actions panel. For simplicity’s sake, we’ll analyze the capture file on the host.
- On the host, list the active containers with:
docker psCONTAINER ID IMAGE COMMAND CREATED STATUS PORTS NAMES67c012a9e92b wordpress:latest "docker-entrypoint.s…" 24 hours ago Up 24 hours 0.0.0.0:8000->80/tcp wordpress-sysdig_wordpress_1f81ef16a5043 mysql:5.7 "docker-entrypoint.s…" 24 hours ago Up 24 hours 3306/tcp, 33060/tcp wordpress-sysdig_db_10cd95a6d2e4f sysdig/sysdig "/docker-entrypoint.…" 24 hours ago Up 24 hours sysdig- Copy the trace file to the host by running the
docker cpcommand followed by the source and the destination path. The source path is formed by concatenating theIDof the container and the path inside of the consider, separated by :. In our example, the source path is0cd95a6d2e4f:/monitoring-wordpress.scapbut yours will be different.
docker cp 0cd95a6d2e4f:/monitoring-wordpress.scap .Now that you’ve copied the trace file to the host, we’ll walk you through two of the most useful action panels.
The Action Panel for Containers
- On the host, start Csysdig with the following command:
csysdig -r monitoring-wordpress.scap- Navigate to the
Containersview and then press theF8key. On the left side, you will see the list of available actions:

- As an example, let’s start a shell inside of the
wordpresscontainer by pressing thebkey. - At this point, you can perform whatever actions you want:

- When you’re done, enter the
exitcommand, and you will be taken back to the GUI. - From here, you can press the
lkey to display Docker logs:

Similarly, you can invoke the rest of the commands.
The Action Panel for Processes
- In the main view, highlight a process and then press the
F8key. This will display a different set of actions:

From here, you can choose whatever action you want to perform by pressing the corresponding hotkey.
Configure Csysdig
In this section, we’ll show how you can customize Csysdig to your preferences. The following example will:
- Change the hotkey that triggers the
docker pausecommand. - Add the
docker pscommand to the list of available commands and assign a hotkey to it.
- On the host, open (as root) the
/usr/share/sysdig/chisels/v_containers.luafile. As an example, if your editor of choice isvi, then you should enter the following command:
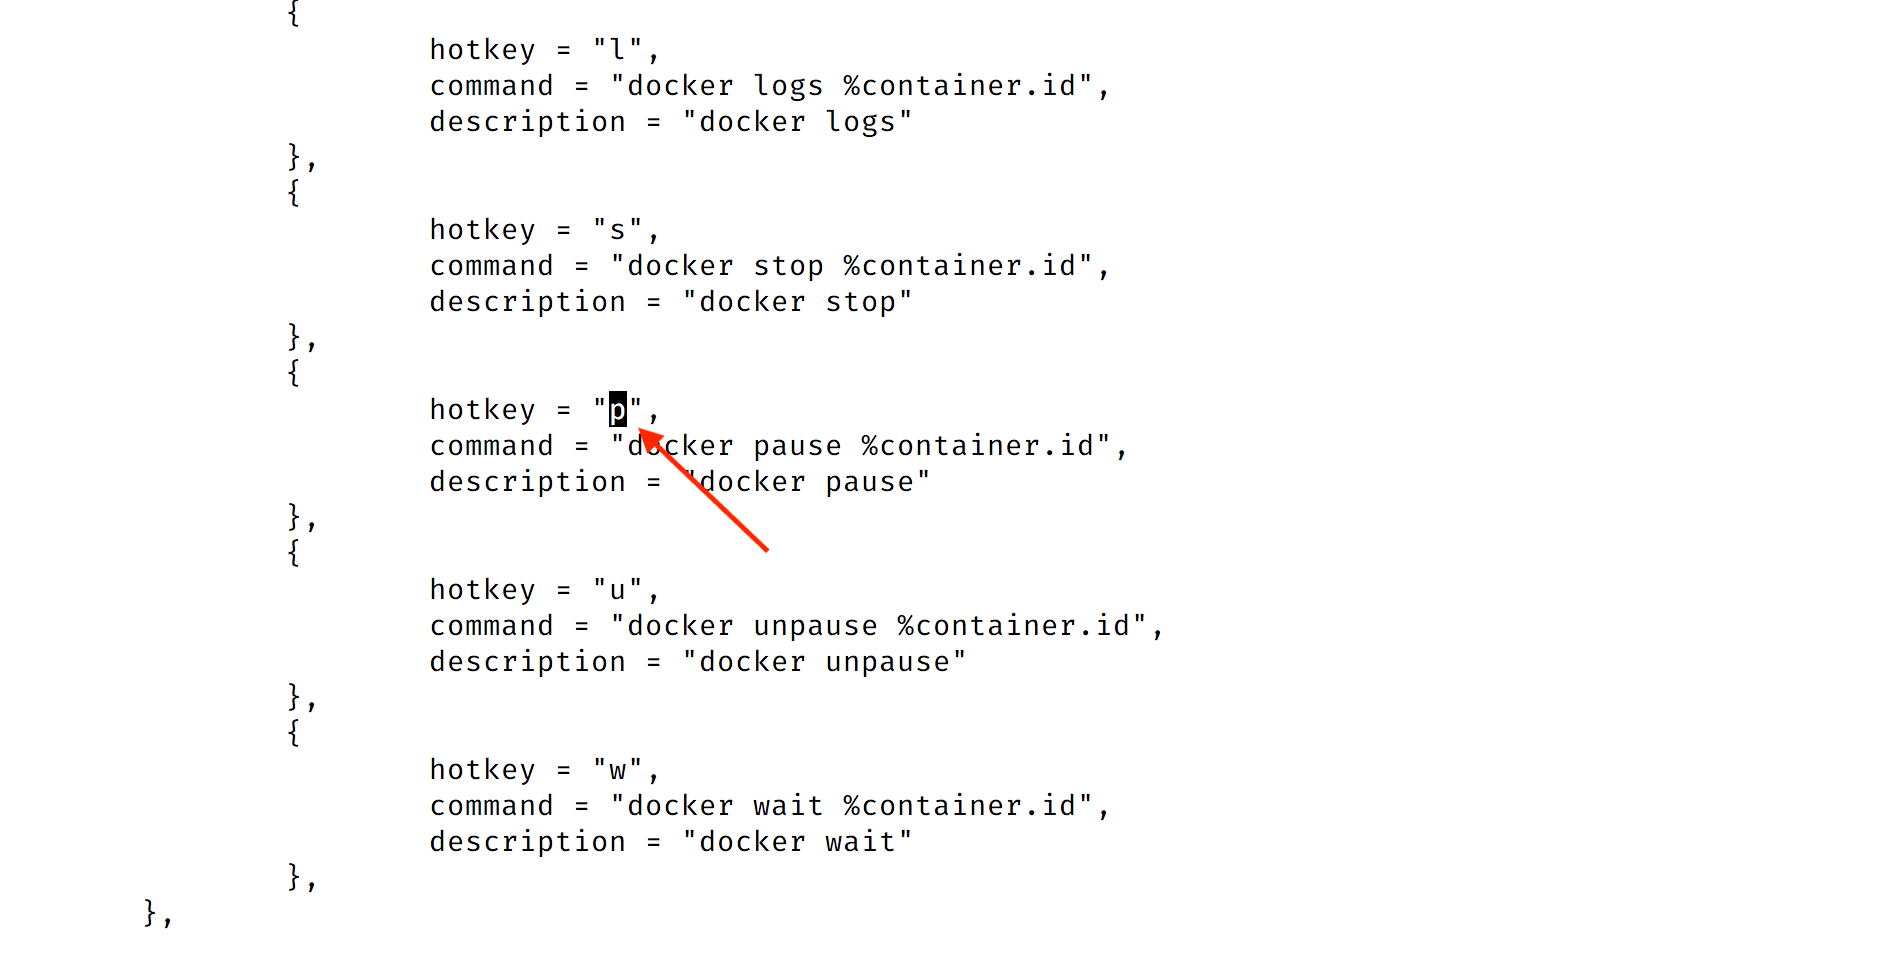
sudo vi /usr/share/sysdig/chisels/v_containers.lua- Set the hotkey for the
docker pausecommand top:
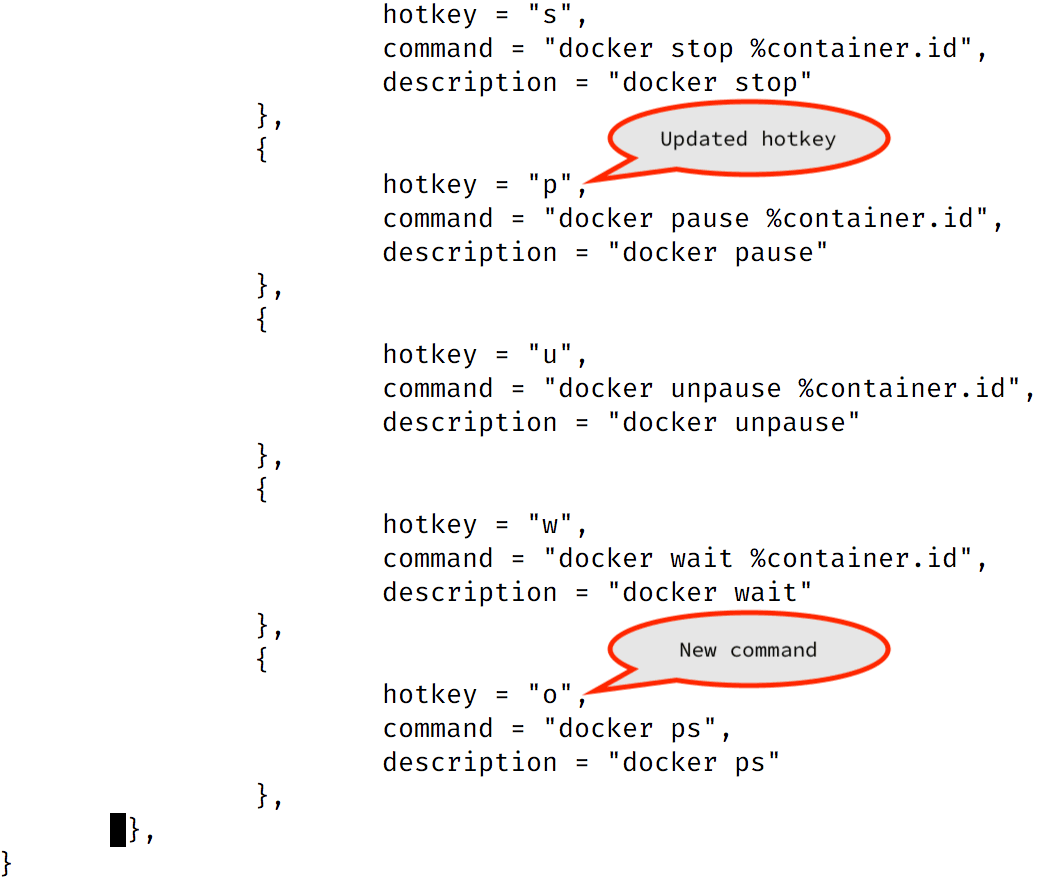
- At the bottom of the file, add a new command by pasting the following snippet into the
actionsobject:
{ hotkey = "o", command = "docker ps", description = "docker ps"},With these updates, your /usr/share/sysdig/chisels/v_containers.lua should look similar to the following:
- Save the file. If you’re using
vi, type:wq!and then press theEnterkey.
An in-depth explanation of how you can write more complex views and actions is outside of the scope of this tutorial. Refer to the Csysdig View Format Reference page to further your knowledge.
- Start Csysdig and then navigate to the
Containersview. From there, press theF8key to display the list of actions:
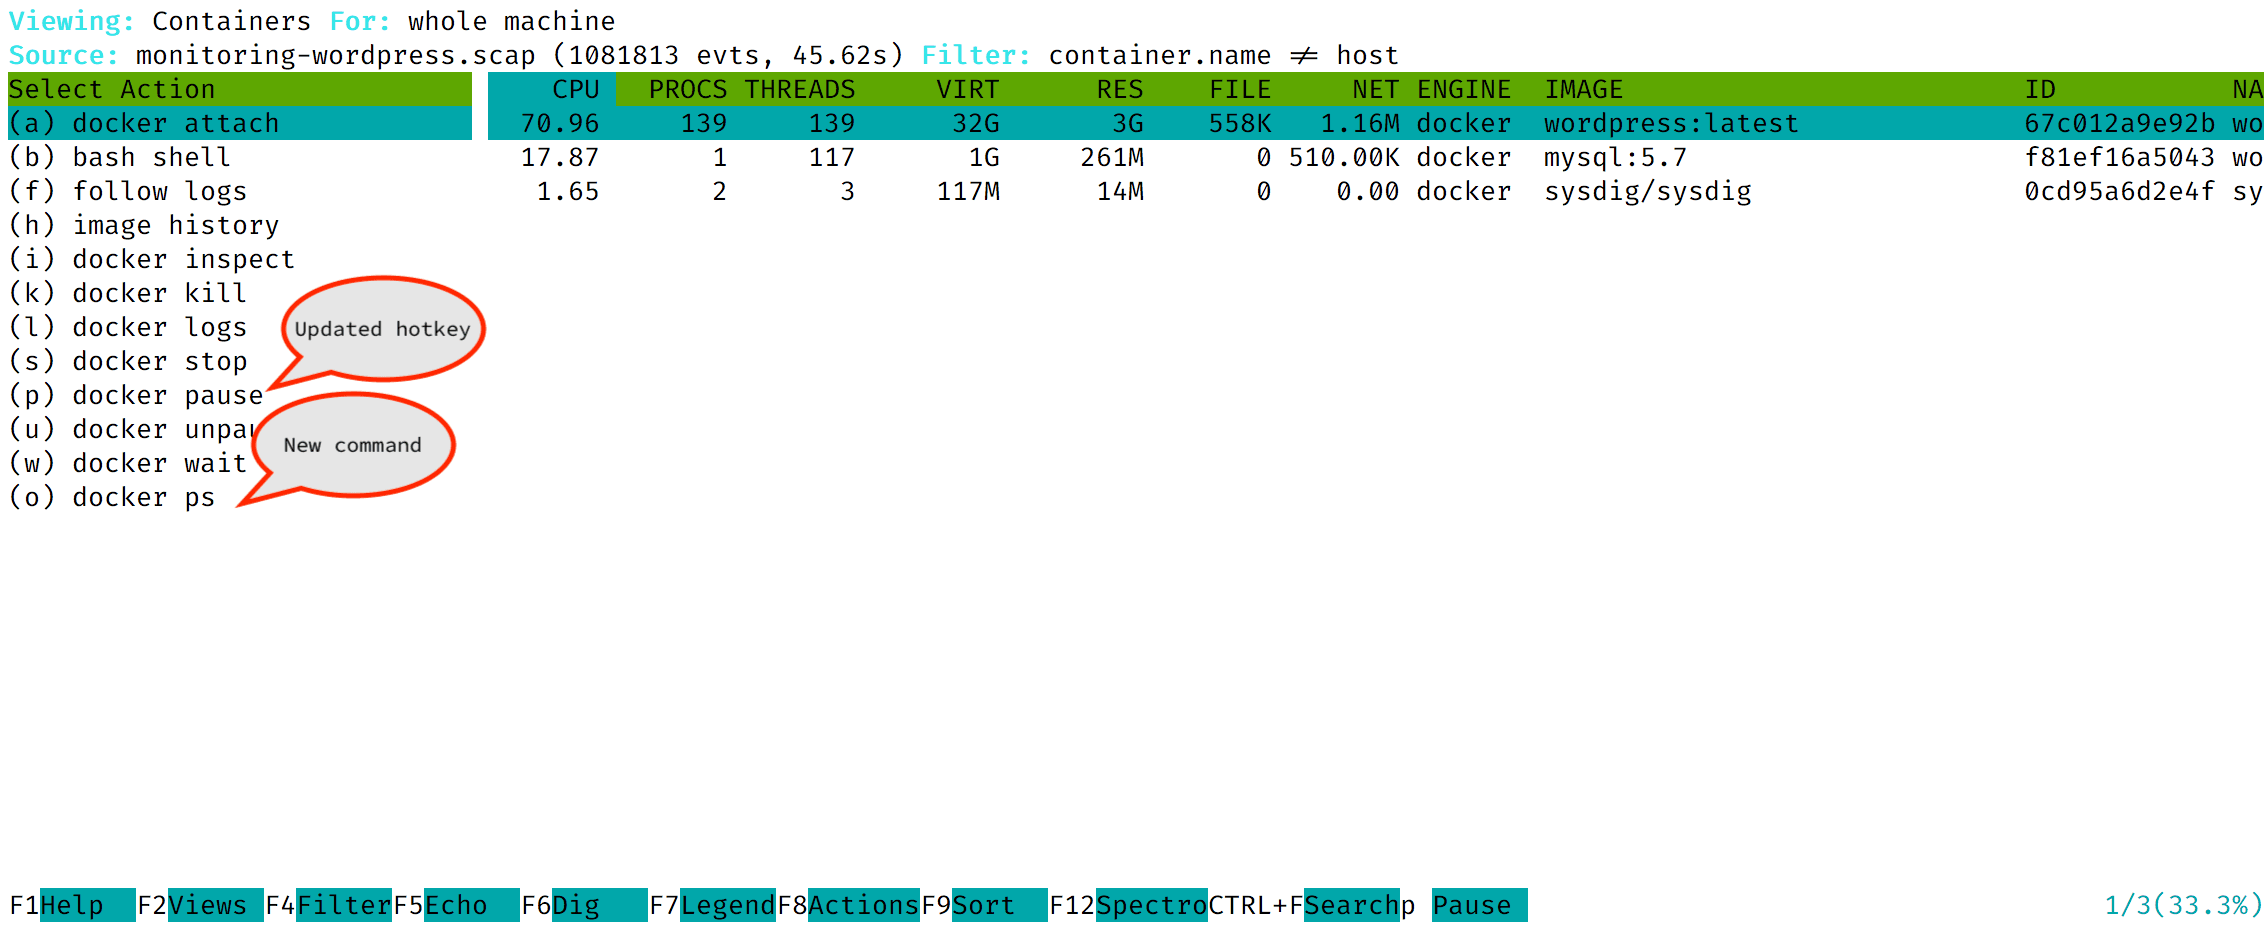
Note that the list of actions has been updated!🤓
- Press the
pkey to pause the container. You’ll see the following confirmation message:
67c012a9e92bCommand finished. Press ENTER to return to csysdig.In the output above, the id of our container is 67c012a9e92b. Yours will be different.
- You can use the new command you’ve just added to check if everything went well. Type the
okey, and you’ll see something similar to this output:

Hooray, your container has been paused!
This concludes the second part of our series about Sysdig. In part three, we’ll focus on container troubleshooting and security investigation with Sysdig Inspect.
Related articles
Subscribe to our newsletter
Get the latest industry trends, exclusive insights, and Gcore updates delivered straight to your inbox.


