How to Configure Grafana for Visualizing Kubernetes (K8s) Cluster Monitoring
- By Gcore
- July 25, 2024
- 3 min read

Kubernetes monitoring allows you to observe your workloads and cluster resources, spot issues and failures, and efficiently manage pods and other resources. Cluster admins should prioritize tracking the performance and stability of clusters in these environments. One popular tool that can help you visualize Kubernetes monitoring is Grafana. This monitoring solution lets you display K8s metrics through interactive dashboards and real-time alerts. It seamlessly integrates with Prometheus and other data sources, providing valuable insights.
Gcore Managed Kubernetes simplifies the Grafana setup process by providing a managed service that includes tools like Grafana. In this article, we’ll explain how to set up and configure Grafana to monitor Kubernetes, its key metrics, and dashboards.
Setting Up Grafana for Effective Kubernetes Monitoring
To begin monitoring Kubernetes with Grafana, first, check that you have all the requirements in place: a functioning Kubernetes cluster, the Helm package manager installed, and kubectl set up to communicate with your cluster.
- Install Grafana in a Kubernetes Cluster. Start by adding the Grafana Helm repository.
helm repo add grafana https://grafana.github.io/helm-chartshelm repo update- Next, install Grafana using Helm. This command deploys Grafana into your Kubernetes cluster:
helm install grafana grafana/grafana- Now it’s time to configure Grafana for the Kubernetes environment. After installation, retrieve the admin password by using the command below:
kubectl get secret --namespace default grafana -o jsonpath="{.data.admin-password}" | base64 --decode ; echo- Then access the Grafana UI by port-forwarding:
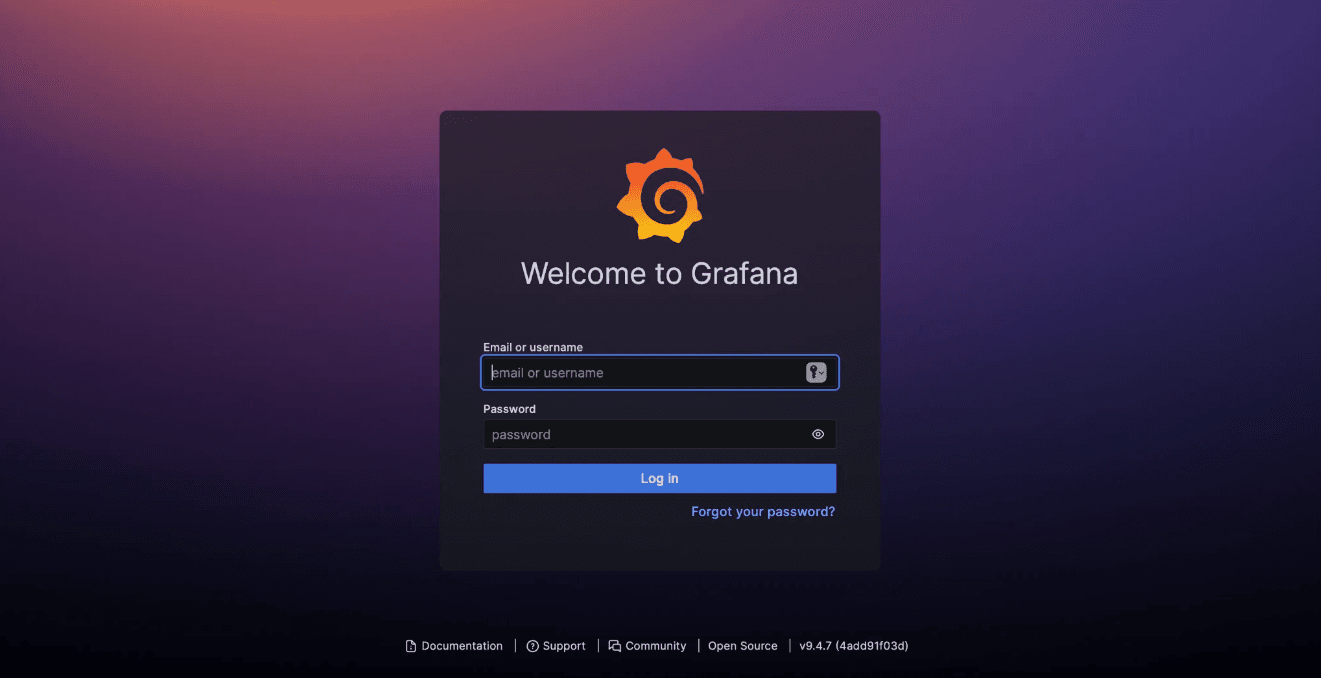
kubectl port-forward svc/grafana 3000:80- Open your web browser and navigate to http://localhost:3000. Log in using the default username admin and the password you retrieved. Once logged in, you can configure Grafana to monitor your Kubernetes environment by adding data sources such as Prometheus and creating custom dashboards.
You’ve now successfully set up Grafana for Kubernetes monitoring!
Key Metrics for Kubernetes Monitoring
Understanding metrics for Kubernetes monitoring allows you to visualize your cluster’s reliability. Key metrics are the following:
- Node resources. Track CPU and memory usage, disk utilization, and network bandwidth to understand resource consumption and identify bottlenecks.
- Cluster metrics. Monitor the number of nodes to understand resource billing and overall cluster usage, and track running pods to determine node capacity and identify failures.
- Pod metrics. Measure how pods are managed and deployed, including instances and deployment status, and monitor container metrics like CPU, memory, and network usage.
- State metrics. Keep an eye on persistent volumes, disk pressure, crash loops, and job success rates to ensure proper resource management and application stability.
- Container metrics. Track container CPU and memory usage relative to pod limits, and monitor network data to detect bandwidth issues.
- Application metrics. Measure application availability, performance, and business-specific metrics to maintain optimal user experience and operational health.
Setting Up Grafana Dashboards
You can opt to design and tailor Grafana dashboards to monitor your Kubernetes cluster. This will help you better understand your systems’ performance and overall well-being at a glance.
- Log into Grafana. Open your web browser, go to http://localhost:3000/, and log in with the default credentials (admin for both username and password), then change your password if/when prompted.
- Add data source. Navigate to Configuration and select Data Sources. Click on Add Data Source and choose the appropriate data source, such as Prometheus.
- Create a dashboard. Go to Create > Dashboard, click Add New Panel, choose the panel type (e.g., Time series chart, Gauge, Table), and configure it with a PromQL query and visualization settings.

- Organize and save the dashboard. Arrange panels by clicking Add Panel > Add Row and dragging panels into the desired rows. To save the dashboard, click the save icon, name it, and confirm the save.
Gcore Managed Kubernetes for Kubernetes Monitoring
Whether you’re getting started with monitoring Kubernetes or you’re a seasoned pro, Gcore Managed Kubernetes offers significant advantages for businesses seeking efficient and reliable Kubernetes cluster monitoring and container management:
- Ease of integrating Grafana: The service seamlessly integrates with Grafana, enabling effortless visualization and monitoring of performance metrics via dashboards.
- Automated control: Gcore Managed Kubernetes simplifies the setup and monitoring process by using automation. This service conducts health checks on your nodes, automatically updating and restarting them when needed to keep performance at its best.
- Enhanced security and reliability: Gcore Managed Kubernetes guarantees the management of nodes by integrating features like automatic scaling and self-repairing systems to maintain optimal performance.
Discover Gcore Managed Kubernetes, including automated scaling, one-click provisioning, and Grafana integration.
Related articles


Imagine discovering that migrating your company's data to a new cloud provider will cost hundreds of thousands of dollars in egress fees alone, before you've even touched the re-engineering work. Or worse, picture being in Synapse Financial

Subscribe to our newsletter
Get the latest industry trends, exclusive insights, and Gcore updates delivered straight to your inbox.