Radar has landed - discover the latest DDoS attack trends. Get ahead, stay protected.Get the report
Under attack?

Products

Solutions

Resources

Partners

Why Gcore

  1. Home
  2. Developers
  3. Containers vs Virtual Machines (VMs)

Containers vs Virtual Machines (VMs)

  • By Gcore
  • September 11, 2023
  • 12 min read
Containers vs Virtual Machines (VMs)

Virtualization allows multiple operating systems and applications to run on a single physical server, optimizing hardware resources and simplifying management. It comprises two interwoven technologies: containers and virtual machines. While containers are known for their speed, efficiency, and portability, VMs offer robust isolation and security features. This article explains and compares the technologies so you can understand their fit-for-purpose uses and make informed choices about your organization’s infrastructure needs.

Cliff Notes: What’s the Difference Between Containers and VMs?

In the realm of virtualization technologies, containers and virtual machines (VMs) offer distinct approaches to application isolation, resource utilization, and system architecture. Containers leverage OS-level virtualization for high performance and efficient resource sharing, whereas VMs operate on hardware-level virtualization, encapsulating a full guest OS for stronger isolation. These fundamental architectural differences result in varying levels of performance, startup time, and resource utilization.

Both technologies have their own merits and drawbacks when it comes to enterprise deployment, security protocols, and scalability. To understand the pros, cons, and use cases, we first need to look at each technology and its architecture in depth, and then at the end of the article we’ll offer a side-by-side comparison.

What Are Containers?

Containers are virtualized, isolated application packages; they contain everything needed to run a piece of software, including code, system tools, libraries, and settings (called dependencies.) They solve the critical software development and deployment problem of ensuring that software can run properly on different computing environments. This makes the software reliable for end users, an essential feature of any software release. To serve their purpose, containers are portable, meaning they can run across different development environments so that developers can test software on different environments without worrying about conflicts with the underlying system.

Benefits of Containers

Containers have been widely adopted for the following benefits:

  • Faster startup: Containers don’t need an operating system to start running. This means they can start almost instantly.
  • Efficient resource utilization: Containers utilize their host operating system’s kernel (the core part of the computer’s operating system.) This makes them lightweight and resource-efficient as they do not require the extra cost of a separate operating system installation for each container. This saves space and resources, helping things run fast and smoothly.
  • Portability: Containers encapsulate entire applications and their dependencies in a single file, allowing developers to build applications just once and then run them in multiple environments. This portability ensures consistent behavior when containers are moved between development, testing, and production environments, providing flexibility and reducing deployment-related issues.
  • Isolation: Multiple containers (and their dependencies) can share a single OS kernel, while running isolatedly in a way as to ensure that the failure of a container does not affect the function of others within the same environment. Dedicated security tools, such as OS security isolation tools, are also available to pinpoint faulty container parts for efficient remediation.
  • Scalability: You can run several similar containers to create multiple application instances simultaneously. Containerization also allows running only the containers needed for an application to function efficiently at a specific time. As such, containers can be scaled up or down depending on application load. These features make containers highly scalable and cost-effective.

How Do Containers Work?

Containers isolate applications and their dependencies into portable, self-contained units that can be operated anywhere. A container image—an immutable (unchangeable) file with executable code—creates a container. Container images are created using a Dockerfile (or similar configuration files) and stored in container repositories. When a container is instantiated, the image is pulled from the repository onto the host machine. After that, the image is verified, and any missing layers are fetched from the registry. Once the environment is set up, the runtime starts the container and runs the specific command defined in the image.

But What Is a Runtime?

A container runtime is a software package that leverages a container’s host OS to run the container. It creates the necessary environment for the execution of the container, including required namespaces and control groups (usually referred to as cgroups.) Both namespaces and cgroups facilitate resource efficiency: namespaces organize code into groups, and cgroups limit the utilization of resources. The container then runs within the isolated environment, utilizing the resources and namespaces provided by the host operating system.

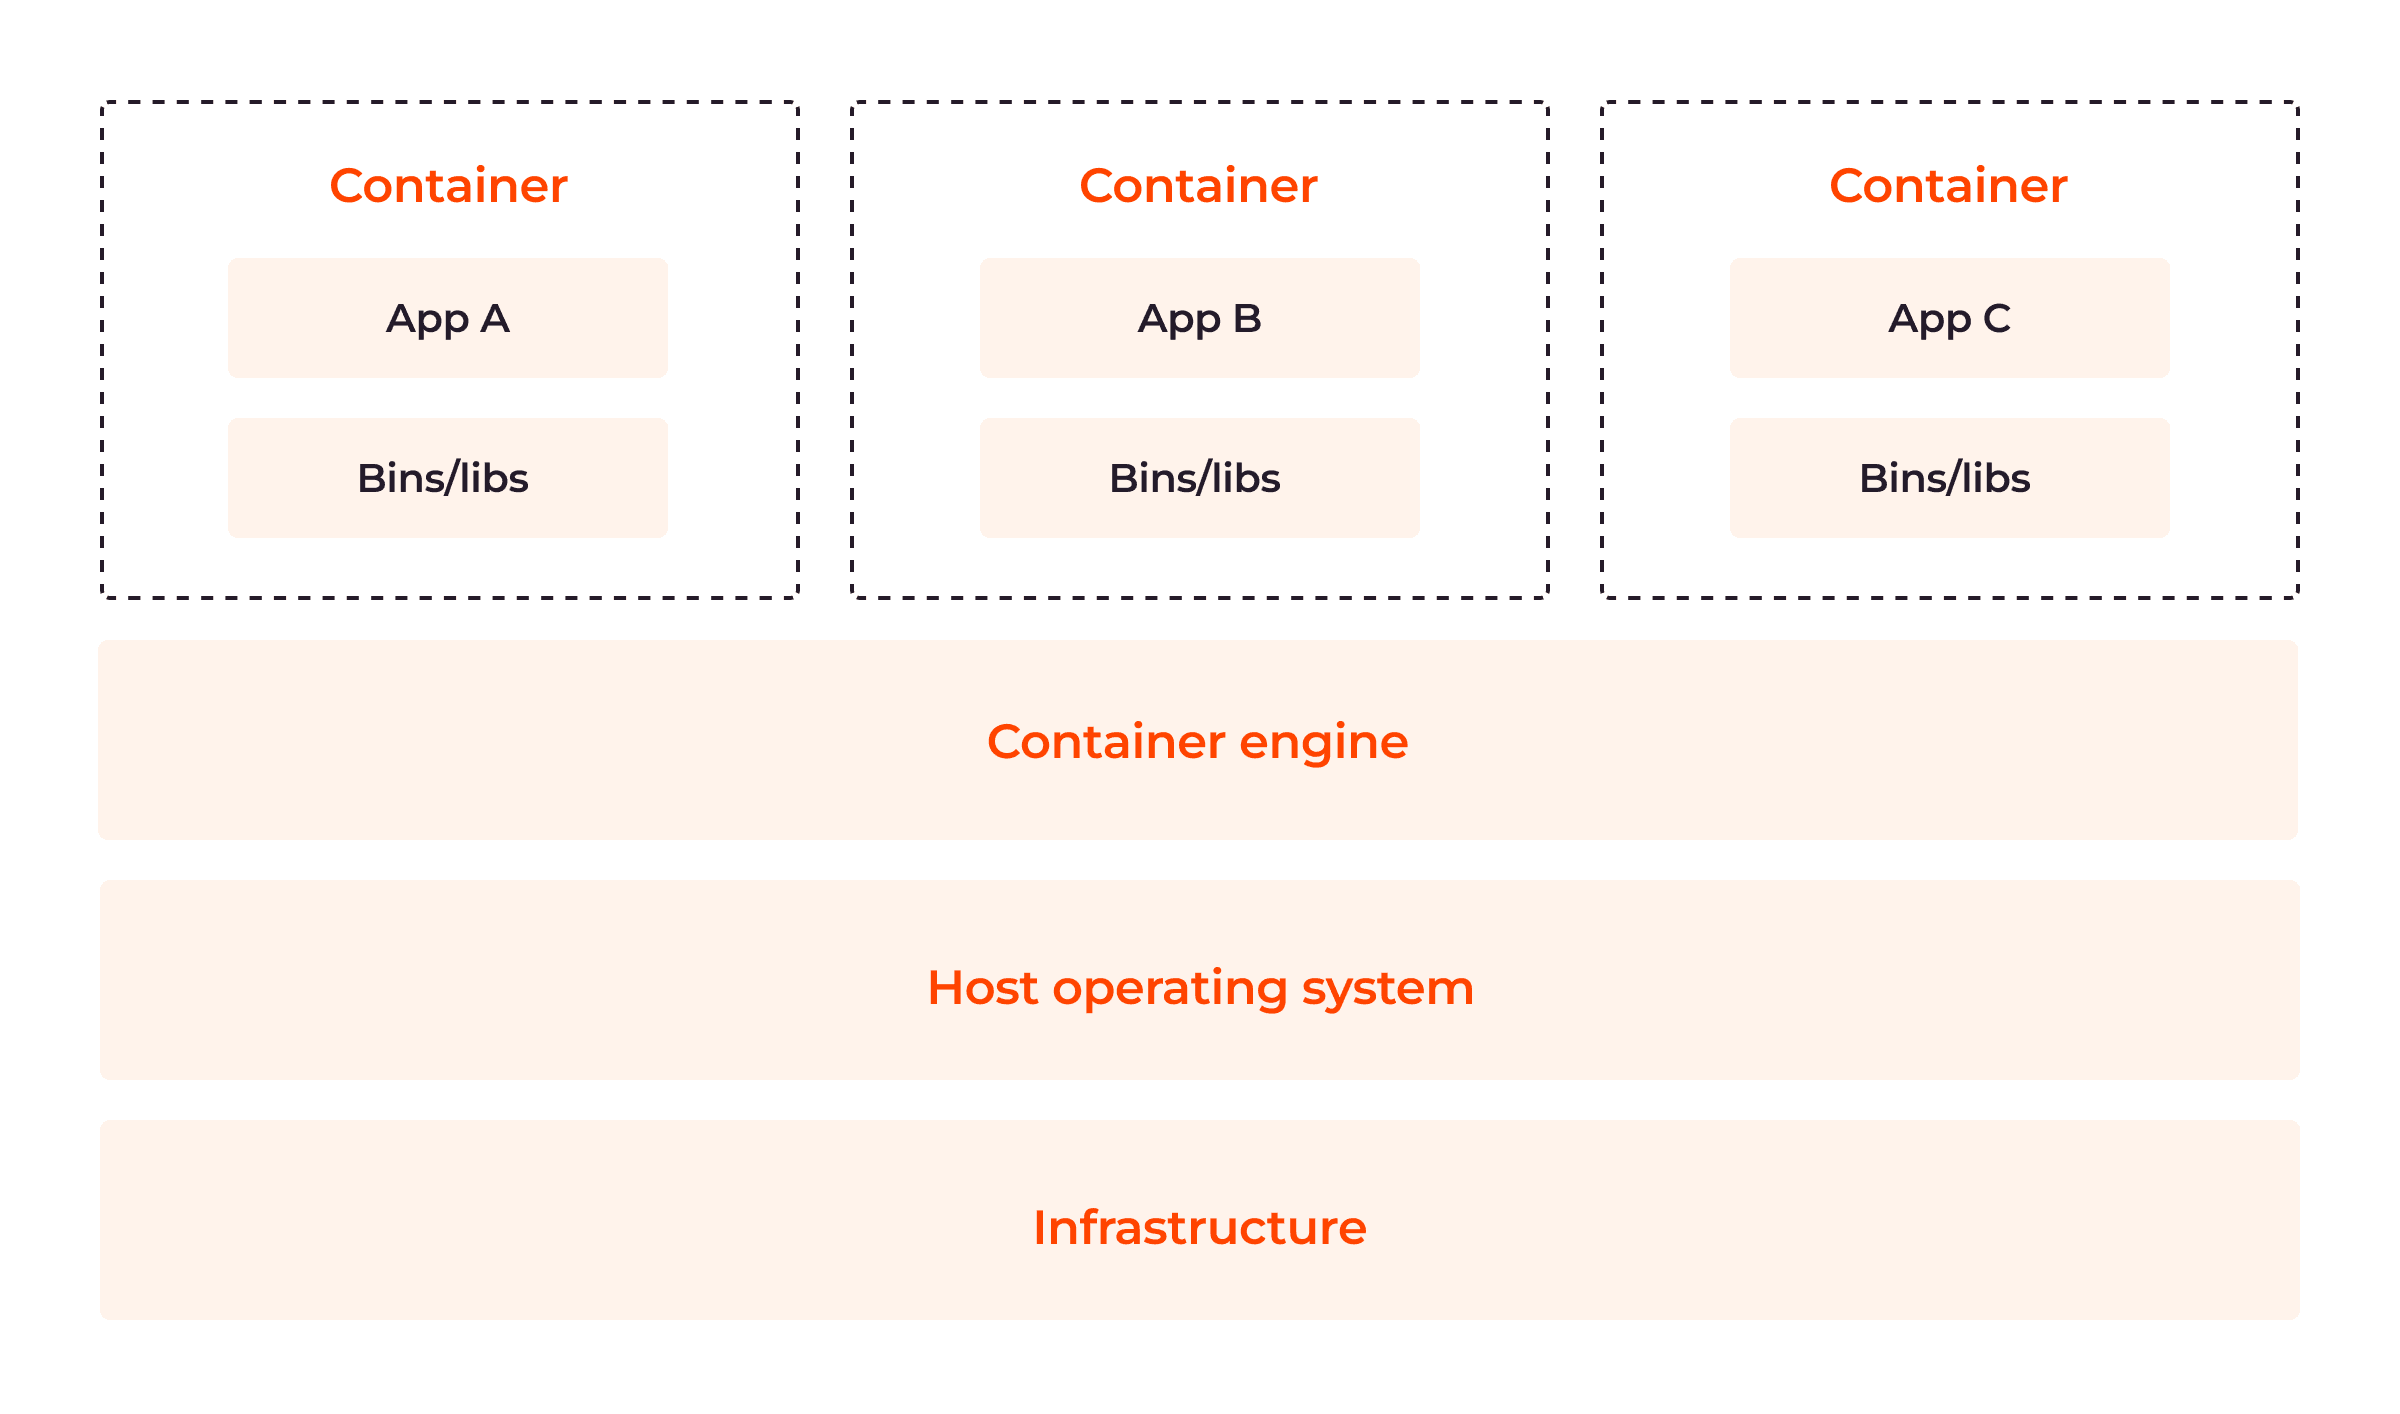
Container Architecture

Containers have six major components: container runtimes, container images, registries, container orchestration platforms, control groups and namespaces. Let’s take a look at each in turn.

Container Runtimes

Container runtimes or engines are software components that are responsible for pulling container images from a registry, setting up the necessary execution environment, managing and executing containers on a host machine, and monitoring containers within the cluster environment. The container runtime also orchestrates the creation and execution of containers.

Container Images

Container images are lightweight, immutable snapshots that contain application codes, dependencies, configuration files, libraries and runtime environments required to run applications. Images have one or more layers built on a parent or base image. They are usually built using Dockerfiles, a text file specifying the instructions to create a layered image representing the application and its dependencies.

The layers of container images make their components and configurations reusable. So, developers do not have to create new ones from scratch whenever images are required. When built optimally, these layers can help to minimize container size and enhance performance.

Images (and other artifacts) make up repositories. Container images have names and tags for easy pushing and pulling. A repository and a tag define an image’s name and allow for easy sharing of container images. A single repository can contain several container images. To modify these read-only images, developers must create a layer—containing all changes made—on top of the parent image.

Relationship between the registry, image, and container

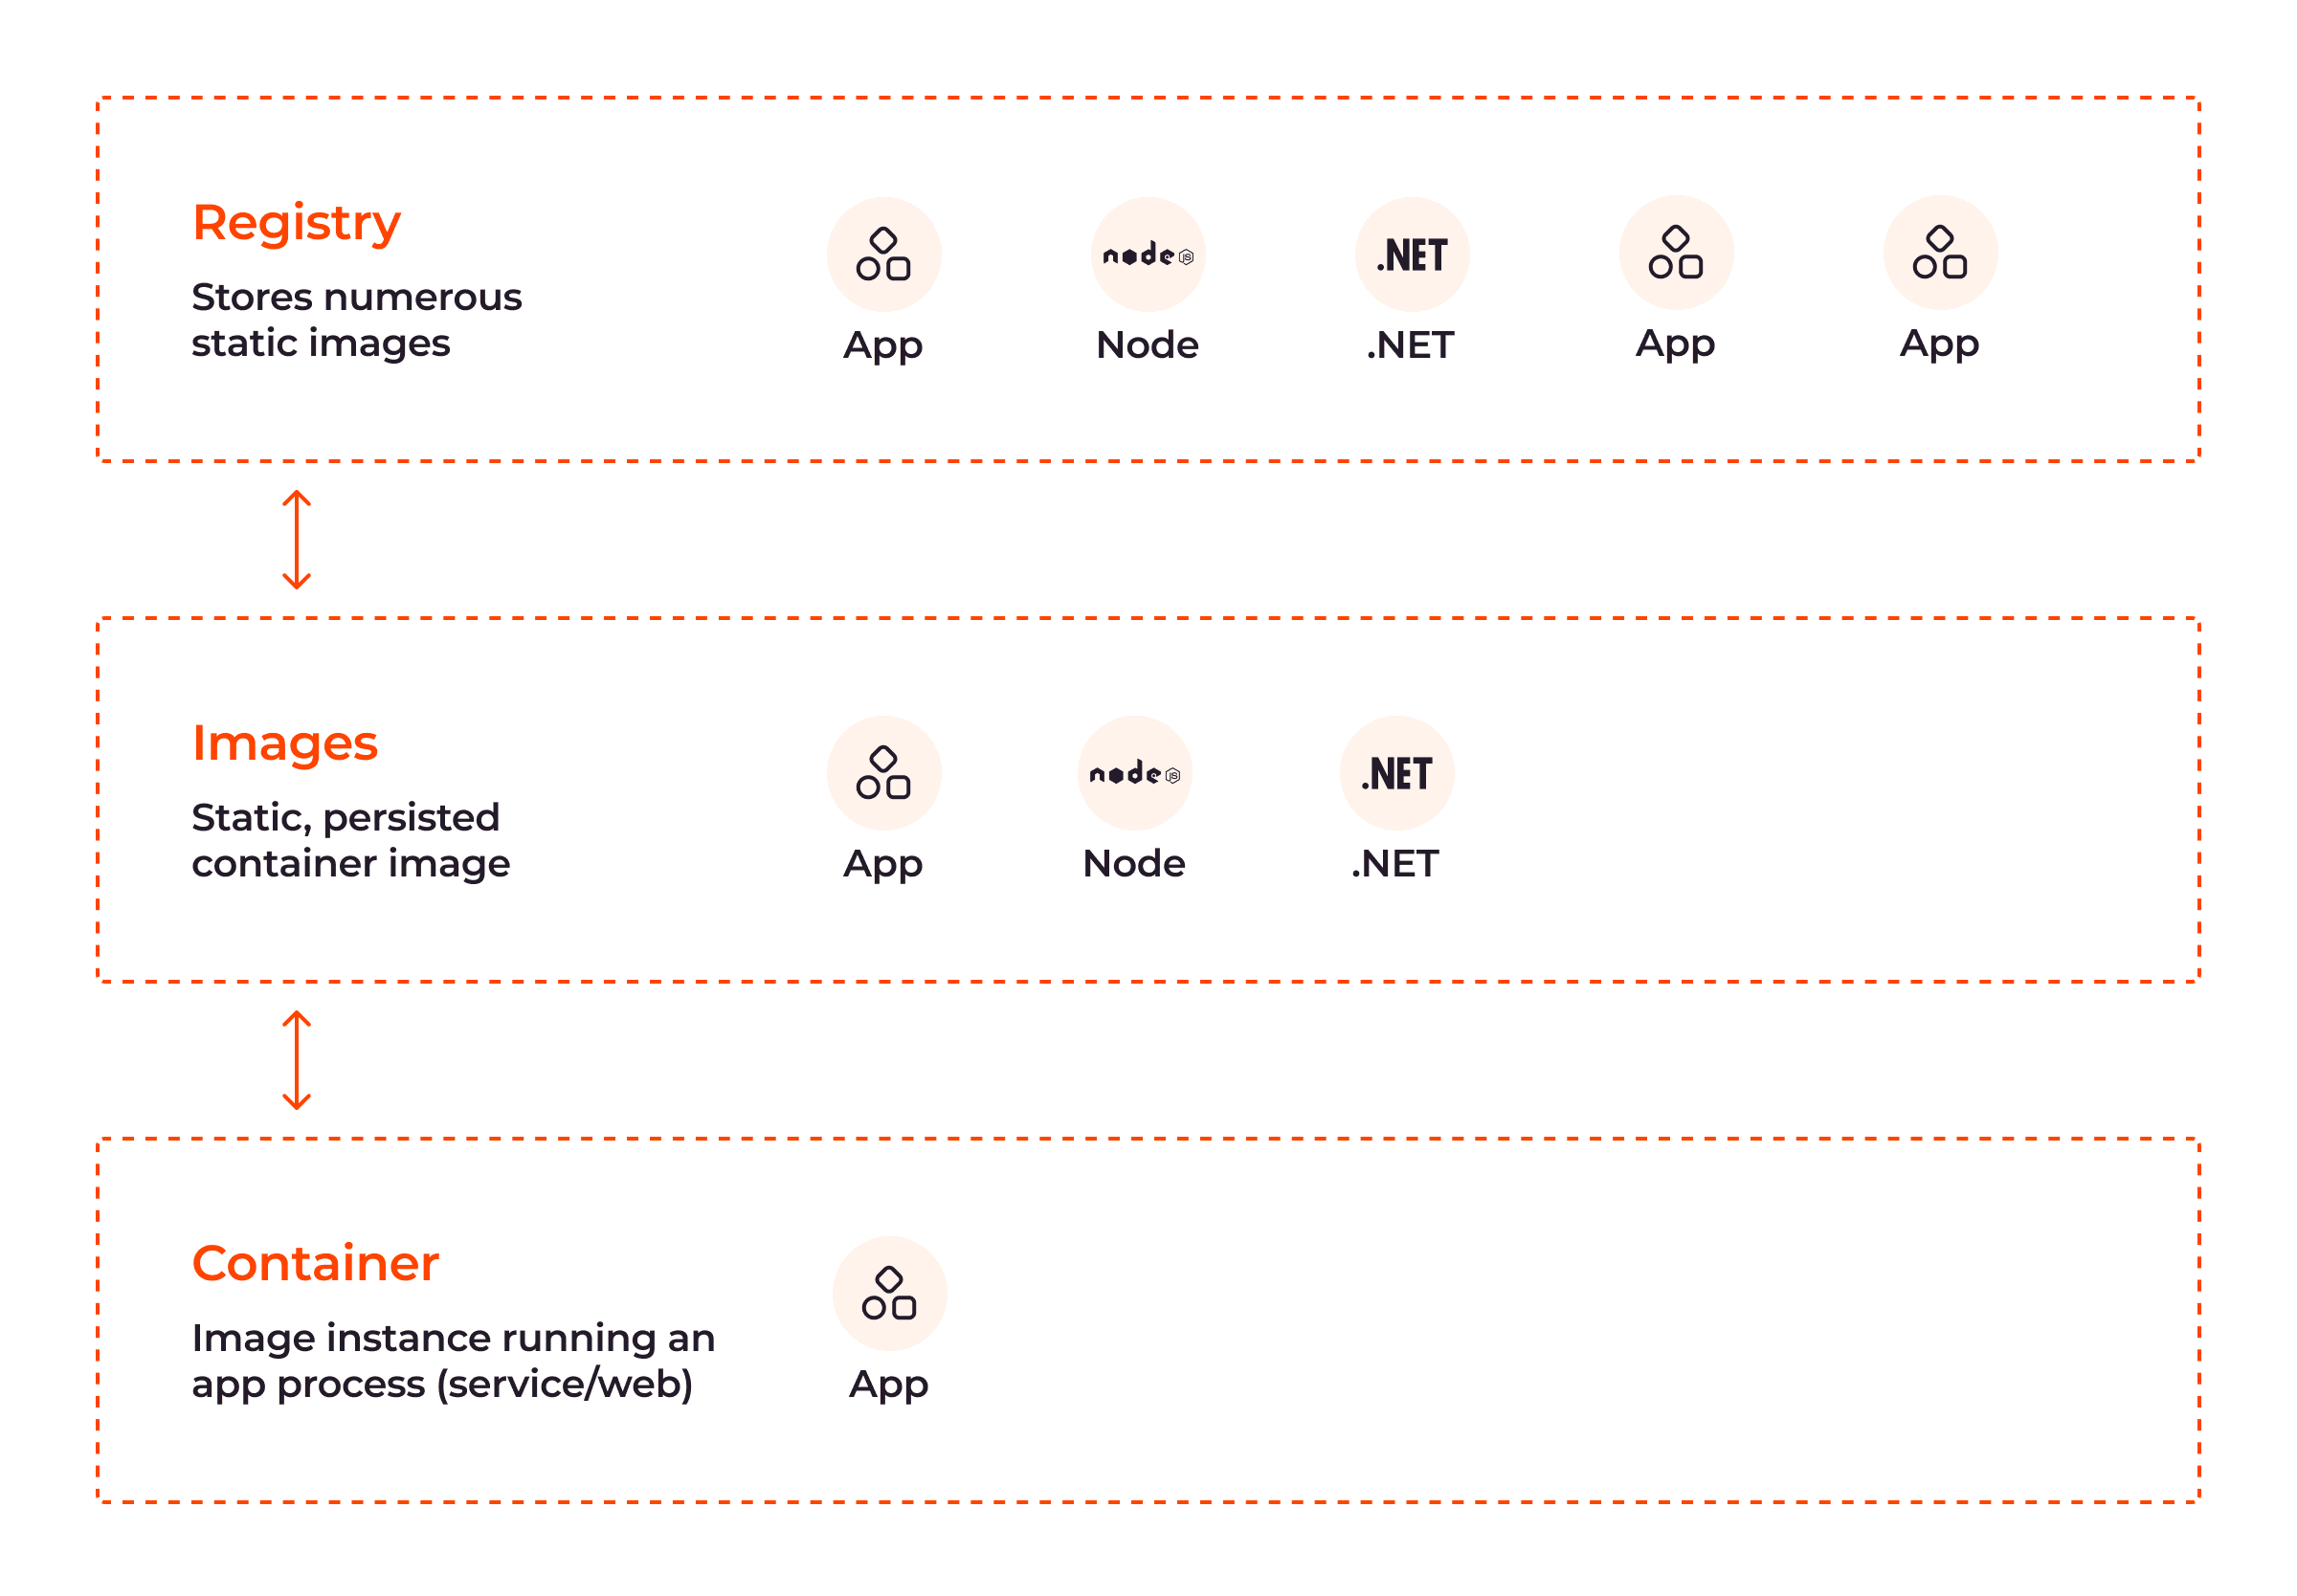
As shown in the above image, container images are stored in registries and can be pulled onto a host machine to create and run containers.

Registries

Registries are central repositories that store and distribute container images to ensure their efficiency. Registries can be public or private.

  • Public: This is a vast collection of prebuilt container images developers can use. DockerHub, a general catalog of container images, is an excellent example of a public container registry.
  • Private: This is a registry where organizations store and manage their own custom container images for privacy and greater control over them.

When an image is pulled from a registry, it is stored locally on the host machine to ensure that containers can be created without a network connection to the registry.

Container Orchestration Platforms

Container orchestration is an approach to automating and managing the deployment of containers to enhance application performance. Platforms—such as Kubernetes—are used to automate the deployment, scaling and scheduling of containers through several features, such as automated scaling, load balancing, and health monitoring.

The container registry, runtime and orchestration platform are three important components of the container orchestration setup required for managing containers throughout the software development life cycle.

Control Groups (cgroups)

The control group is one of the two main kernel OS features of containers, the other being namespaces (explained below.) cgroups provide the following functions:

  • Resource allocation: cgroups limit and prioritize resources (including CPU usage, memory, disk I/O, and network bandwidth) allocated to containers.
  • Process control: Because they can instantiate huge volumes of processes concurrently, containers are attack-prone. This is done to influence the volume of processes and deplete container resources. cgroups can be used to start, stop or restrict the number of ongoing processes, thereby preventing attacks and improving application performance.

Namespaces

Namespaces provide process-level isolation within the OS, ensuring that only the kernel OS gets shared; all other resources are isolated between containers. Namespaces enable containers to run with their own file system views, network stacks, process trees, and user privileges. Containers need their own system views, network stacks, process trees and user privileges to isolate themselves from other systems within the environment. For example, containers are typically given limited access to devices on the host, but with raised privileges, they can access the same capabilities as the host OS, ensuring container isolation.

Each container has its associated namespace that gives the illusion of individuality. There are four major namespaces used to allocate resources to containers:

NamespaceFunction
PID namespaceEnsures each container has its unique set of process IDs
Network namespaceAllows containers to have their own network interface, IP address, and routing table
Mount namespaceAllows containers to have their own root file system while avoiding conflicts with files from other containers
User namespaceProvides user and group isolation

The image below shows the relationship between the components of the container architecture explained above:

The container architecture

Use Cases for Containers

Containers have gained significant popularity due to their versatility and applicability across various industries. Let’s explore some of their notable use cases.

Microservices Security

Microservices are an architectural approach to software development and deployment, where applications comprise small independent and specialized services loosely connected via APIs (Application Programming Interfaces) and REST (representational state transfer) interfaces. Microservices deployed directly on a host OS are less secure because security vulnerabilities can easily spread in the OS layer. In contrast, containerized microservices are more secure and efficient, as containers reduce their attack surfaces, allow for independent patching, and offer control over resource allocation.

Application Packaging and Distribution

Since a container image hosts the application and its dependencies, it is easy to deploy across different environments. You only need to spin a YAML declaration of the container image and deploy it to any environment you choose. This eliminates the “works on my machine” problem often encountered with traditional deployments.

Continuous Integration and Continuous Deployment (CI/CD)

Developers leverage container images to facilitate CI/CD. CI is the practice of continuously making changes to software code and testing for its semantic correctness via an automated process. In-depth integration tests can be expensive, underscoring the value of containerization.

By encapsulating their applications into containers, developers can instantiate them from images throughout different stages of the development lifecycle. This approach, spanning from unit testing to staging and production, saves costs associated with setting up and running CI/CD servers while boosting efficiency.

Hybrid and Multicloud Environments

With containers, applications can be easily migrated across different cloud providers or on-premise infrastructure without extensive application reconfiguration.

Machine Learning, Edge Computing, and Internet of Things

This is another important use case of containers. Containers have increasingly been adopted in edge computing and internet of things (IoT) because they allow for lightweight deployment and enable different services to run on individual containers, thereby reducing the possibility of issues in one service affecting other services. Additionally, with the help of containerized environments, data scientists can ensure experiments are reproducible, easily share their work, and create consistent development environments for machine learning, artificial intelligence, and collaborative projects.

Now that we’ve covered containers, let’s turn to virtual machines.

What Are Virtual Machines?

A virtual machine (VM) is a virtualized emulation of an entire computer system within a host machine, including its hardware and operating system. It provides an environment that isolates the guest OS and applications from the underlying hardware and host operating system to prevent vulnerabilities of one component from affecting the entire cloud environment. A VM is built on a hypervisor, a software layer responsible for creating VMs and managing/allocating the physical resources of a host machine to virtualized guest systems based on their relative importance.

Benefits of Virtual Machines

Virtual machines offer several benefits:

  • Full isolation: A VM runs its own guest OS and application within its isolated environment in a way that ensures applications within one VM do not interfere with or impact applications in another VM.
  • Security: VMs provide strong security boundaries due to their full isolation feature. Compromised applications or vulnerabilities within one VM are generally contained within that specific VM and do not affect other VMs or the host system. This isolation helps protect sensitive data and mitigates the security risks associated with shared infrastructure.
  • OS flexibility: VMs allow different operating systems—including various versions of Windows, Linux and macOS—to be run on the same physical hardware. This flexibility enables organizations to run applications requiring specific operating systems or legacy software compatibility.
  • Resource partitioning: VMs enable the partitioning of physical resources, such as CPU, memory, and disks, among different virtual machines. This facilitates efficient workload management.
  • Snapshot capabilities: VMs offer the ability to take snapshots that capture the state of a VM at a specific point in time. These snapshots can be used for backup, disaster recovery, or testing.
  • Migration capabilities: VMs allow for seamless migration between host machines without service disruption, allowing IT teams to shift workloads or move between servers and machines. Migration is commonly done when VM host systems, including software and hardware, require patching or updating.
  • Hardware abstraction: VMs provide hardware abstraction by rendering physical hardware unnecessary, which helps to ensure software compatibility across different servers, as VMs shield applications from variations in hardware configurations. This helps to save costs associated with physical storage.

How Do Virtual Machines Work?

VMs work as fully isolated guest systems with their own operating systems and applications. They leverage the hypervisor to create and manage multiple isolated virtual environments on a single physical host. When a virtual machine is powered on, the hypervisor intercepts and translates the guest operating system’s instructions to the appropriate physical hardware.

This is enabled by hardware virtualization techniques, such as binary translation and hardware-assisted virtualization. Binary translation is a software virtualization technique in which an interpreter is used to translate the binary machine language code of an application into that of the host OS. Meanwhile, hardware-assisted virtualization involves using a computer’s physical components to provide the software architectural support that VMs need to function properly. Both techniques help to appropriately link and facilitate communication between VMs and the host OS.

Virtual Machine Architecture

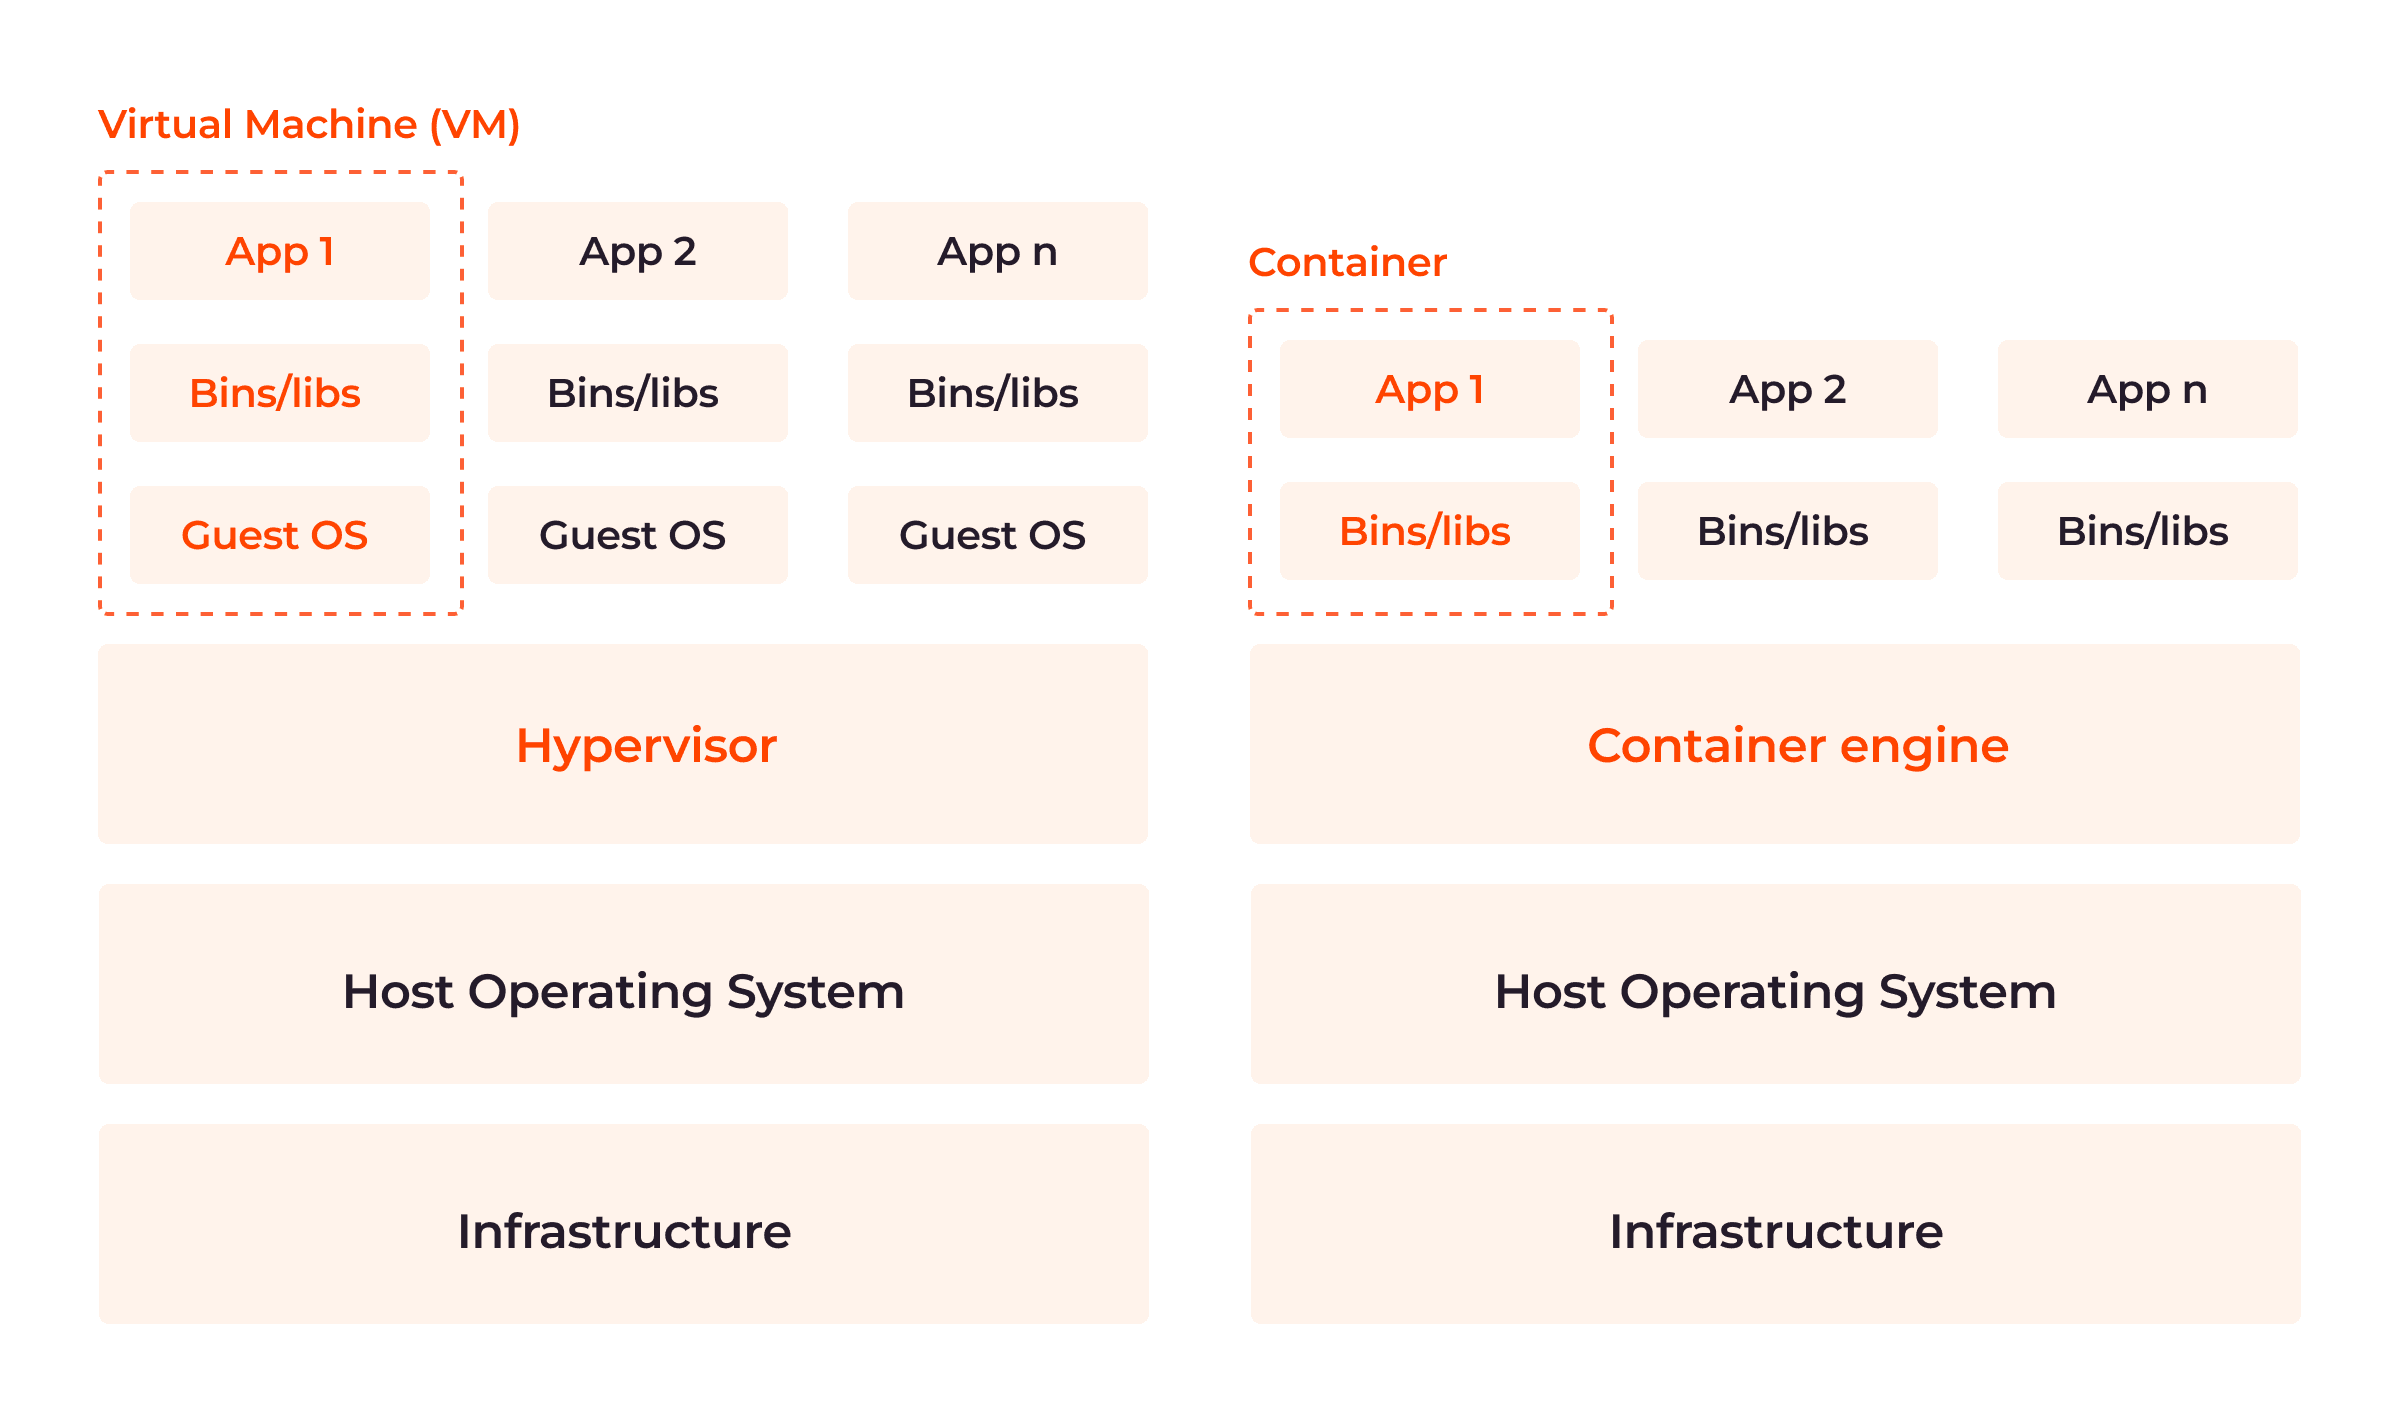
VMs are built on physical machines, with their primary component being a hypervisor, a host server that allows VMs to access the required computing resources. The image below illustrates the four parts of the VM architecture.

VM architecture showing which components comprise the VM vs physical machine

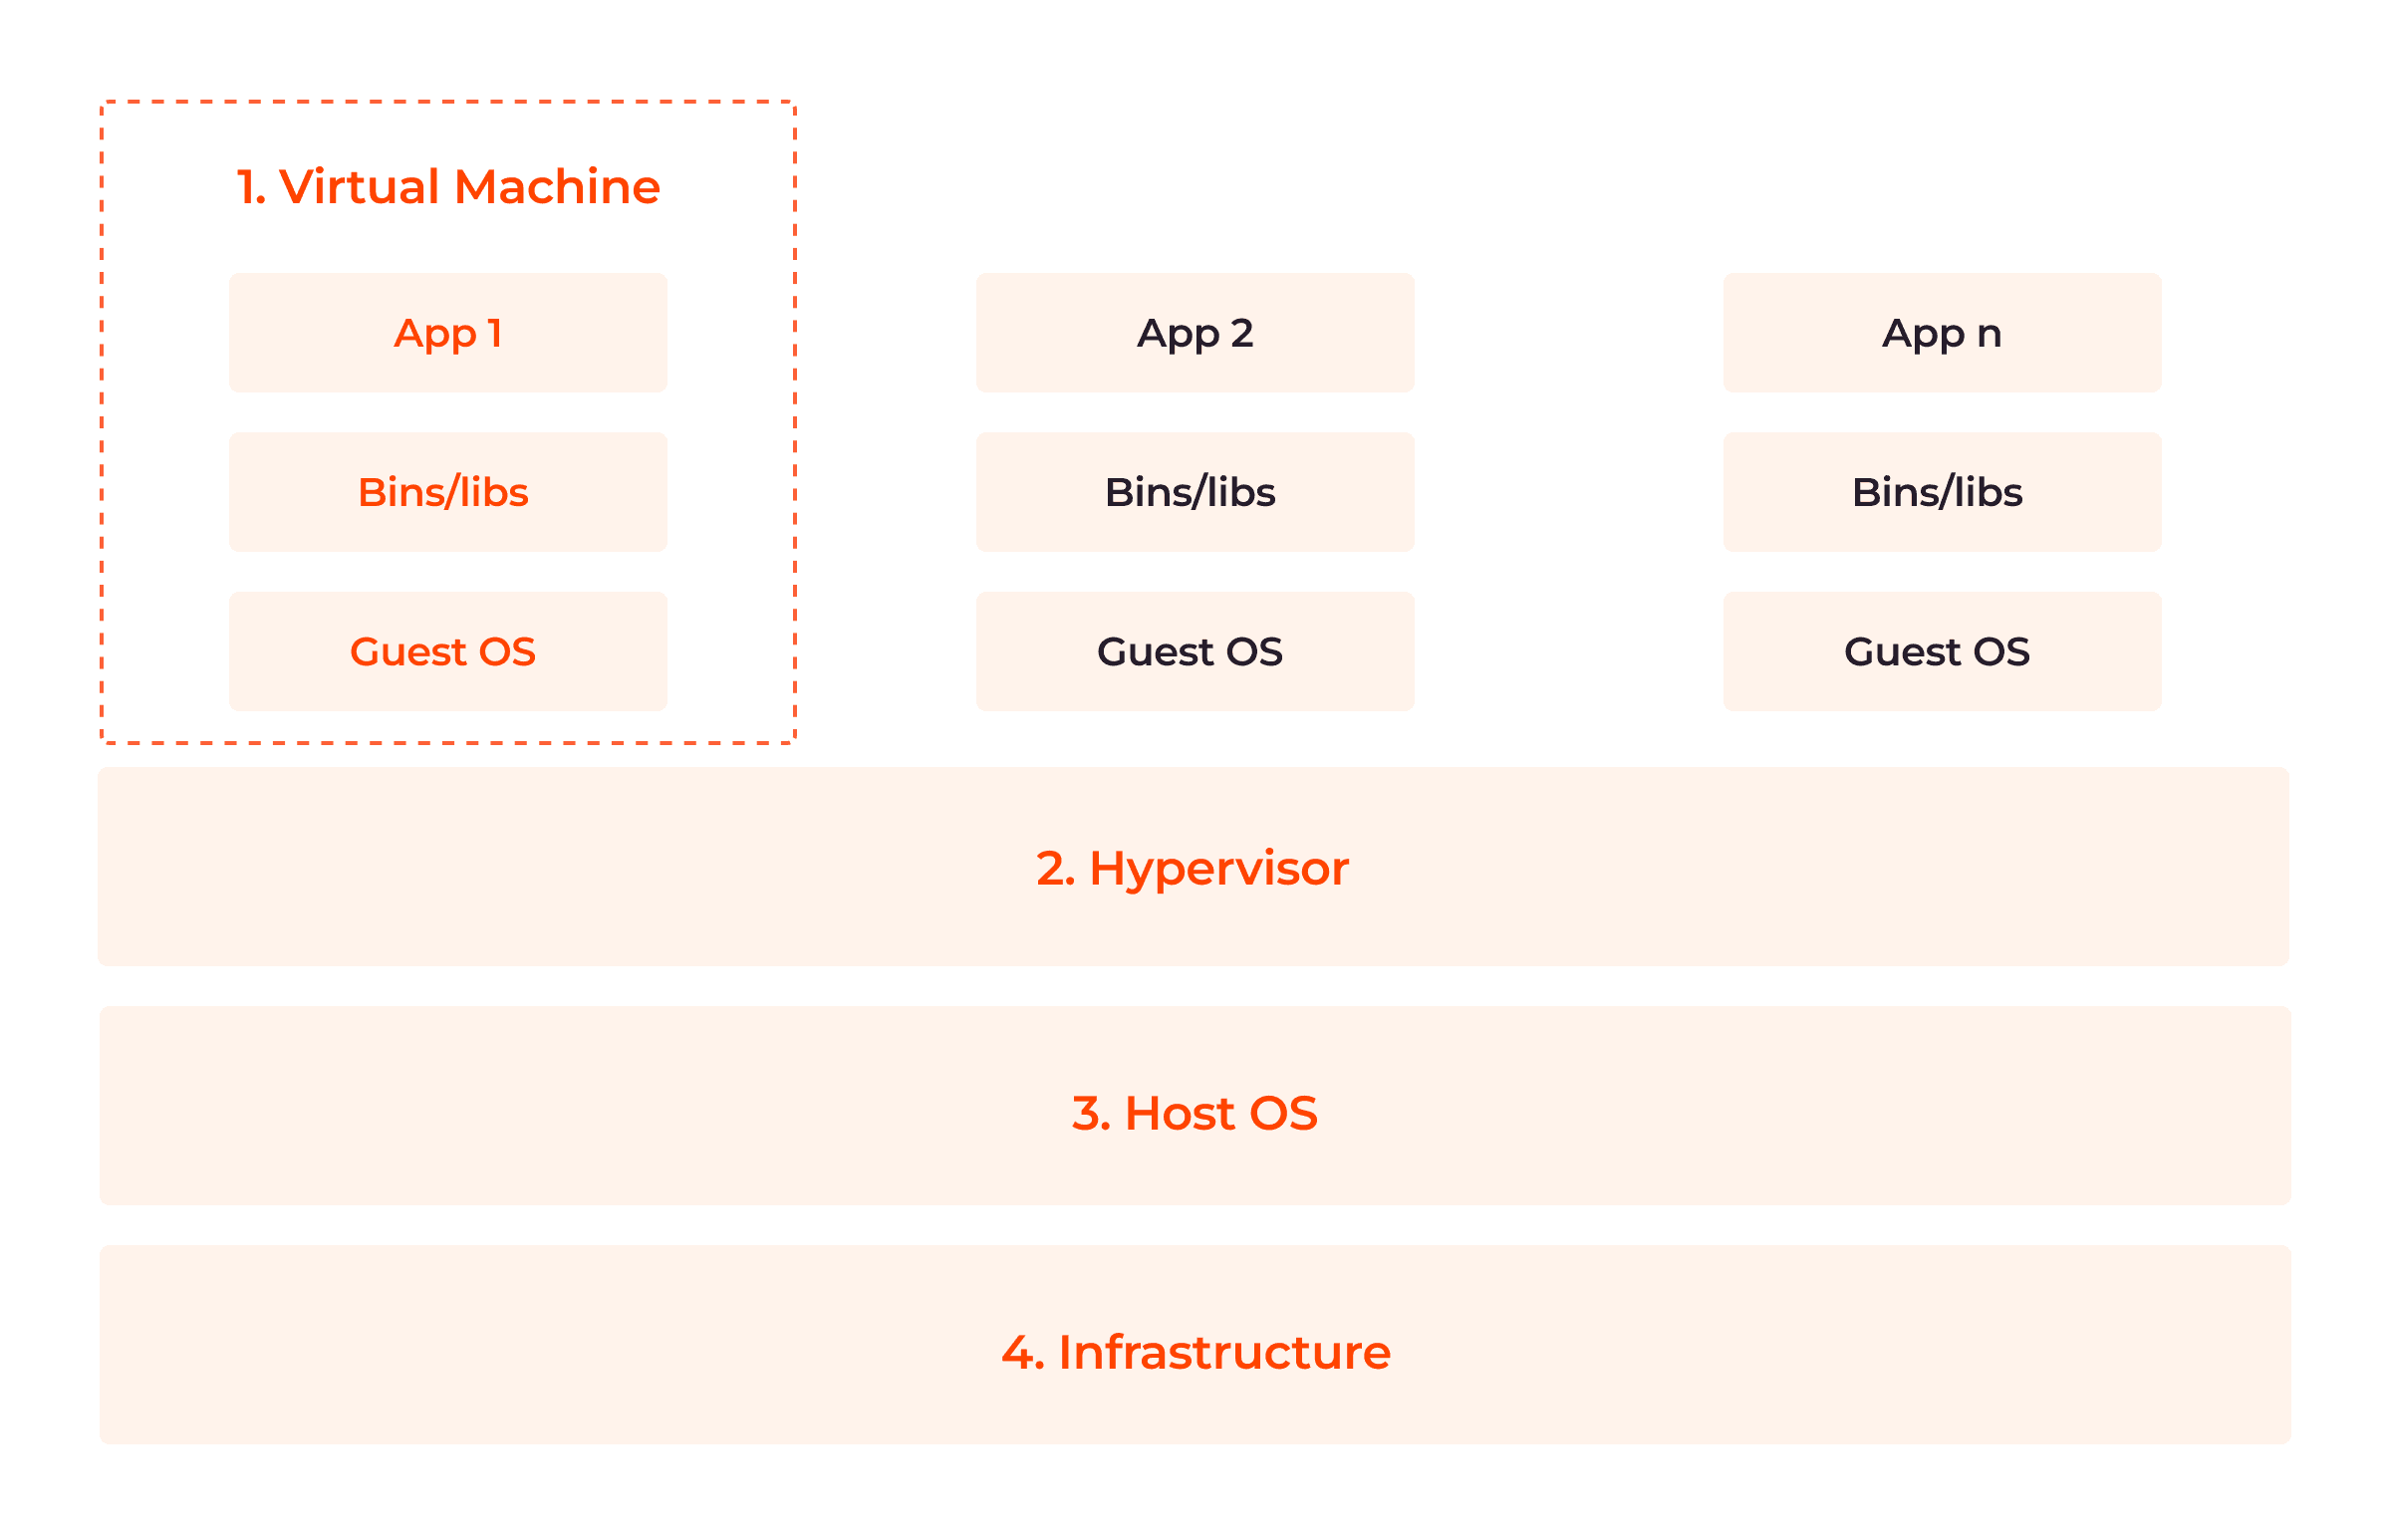
Now, let’s detail these four components.

1. Virtual Machine (App, Bins/Libs, Guest OS)

Virtual machine components include virtualized applications and libraries presented to a guest OS. Each virtual machine has its own guest operating system, which can differ from each other, so that multiple operating systems can coexist on the same infrastructure.

2. Hypervisor

A hypervisor, also known as a virtual machine monitor (VMM,) is a software layer that enables the creation and management of VMs on the physical host machine/infrastructure. There are two types of hypervisors:

  • Type 1 (bare metal hypervisors) that run directly on the host machine’s hardware, without the need for an underlying OS. They have direct access to the hardware resources and manage the virtual machines at a low level.
  • Type 2 hypervisors run as applications on top of the existing OS. They rely on the host operating system to manage the hardware resources and provide a layer of virtualization on top of it.

3. Host Operating System

The host OS exists between the hypervisor and the infrastructure. They provide isolation between the virtual machine and the components of the infrastructure by limiting the data that flows from one to the other. This enhances both host and guest security.

4. Infrastructure

The infrastructure is the underlying hardware on which virtual machines are created and executed. It provides the necessary computing resources, such as CPU, memory, storage, and network.

How Are Virtual Machines Used?

Virtual machines are used across various industries and use cases, including the following:

Legacy Application Support

Virtual machines are commonly used to support and maintain legacy applications that were originally designed for an older OS or for specific hardware configurations. By running legacy applications on virtual machines, organizations can preserve the functionality and dependencies of these applications while modernizing their underlying infrastructure.

Multitenancy and Cloud Computing

VMs are used extensively in cloud environments where multiple customers share the same physical infrastructure. This is because they ensure cost-effectiveness and provide isolation, security, and customization while maximizing resource utilization for the cloud provider.

Development Environments

VMs provide convenient and isolated environments for developers to work on different projects with varying software requirements. Multiple VMs can be set up, each running a different development or testing stack, allowing for easy setup, experimentation, and reproducibility.

Testing and Debugging

VMs provide a controlled and reproducible environment for software testing and debugging. Testers can create multiple VM snapshots to capture various points in the software testing process, facilitating easy rollbacks, bug reproduction and debugging. Rollbacks involve reducing VMs to previous states to erase (or reduce) errors in current states, and bug reproduction is the process of reproducing a bug in a software to visualize how it got there in the first place. Both procedures facilitate debugging, patching and data retrieval. VMs offer a convenient way to test software compatibility across different OSes, reducing the need for multiple physical systems.

Security Research and Disaster Recovery

VMs are used for security research as well as vulnerability and malware analysis. Researchers can isolate and analyze potentially harmful applications or websites within VMs to prevent damage to host systems or networks.

What Are the Differences Between Containers and Virtual Machines (VMs)?

Although both are powerful and efficient, one has an edge over the other. As shown in the image below, the major architectural difference between both containers and VMs is the presence or absence of a guest operating system in the virtualization layer.

VMs vs Containers

Consider the table below for a close-range comparison:

FeaturesContainersVirtual Machines
ArchitectureApplication- or OS-level virtualization technology. Containers share the host OS kernel but have separate user spaces.Infrastructure or hardware-level virtualization technology. Each VM has its own kernel, file system, and memory allocation.
PerformancePerform better than VMs because they share the host operating system kernel. Lower overhead and improved performance.Reduced performance compared to containers, due to the overhead of running a full guest OS alongside the host OS.
Resource utilizationEfficient resource utilization due to leveraging their host’s resources directly.May be less efficient. Require dedicated resources for each virtual instance, including a separate guest OS.
LatencyLower latency as they directly access the host hardware, bypassing virtualization layers.Introduce additional layers of virtualization, leading to increased latency compared to containers.
Startup TimeOffer near-instant startup times.Longer startup times because they need to boot a complete guest OS for each instance.
IsolationUse OS-level isolation which is not as strong as hardware-level virtualization.Provide full isolation since each VM runs on a separate hypervisor.
PortabilityHighly portable, allowing for consistent behavior across different systems.Less portable as they may require configuration changes to work in different environments due to differences in hardware and OS versions.
SecurityPotential for security vulnerabilities due to the shared host OS kernel. Runtimes provide features like namespaces and control groups help to mitigate security risks.Higher level of security due to strong isolation between each VM.
FlexibilityGreater flexibility in terms of resource allocation and scaling.Limited flexibility; they require a fixed allocation of resources. Changes to resource allocation require adjusting VM configuration.
DensityDue to their lightweight nature, containers can be packed more densely on a host machine.Less dense due to resource overhead.
EfficiencyMore efficient in terms of storage and memory utilization.Require additional storage and memory, since each instance requires a full guest OS alongside the application.
Deployment complexitySimplified deployment process using container images.More complex deployment process, involving provisioning and configuring a guest OS on each virtual instance.
Use casesWell-suited for microservices architecture, continuous integration/continuous deployment, scaling applications, and managing distributed systems.Commonly used for running legacy applications, testing different operating systems, creating isolated OS environments, and development sandboxes.

Choosing Between Containers and Virtual Machines

Although both containers and VMS have revolutionized application development and deployment, your choice will depend on your applications’ specific use case, performance requirements, and isolation needs. Containers and VMs can be combined with containers running inside VMs to leverage the benefits of both technologies. To do this, create a virtual machine with a distinct hardware configuration and install an OS within it. Then, install a container runtime on the OS.

However, it is critical to note that containers lend themselves better to modern practices and use cases and offer portability that is important for multi-cloud environments. For instance, containers are more lightweight and use far fewer resources than virtual machines. If a physical server can host only ten virtual machines, it could host twenty containers or more.

Conclusion

Virtualization is undergoing a staggering rise in both popularity and market size, with its value currently estimated at $40–62 billion and expected to reach over $120 billion in revenue by 2027 according to Statista. As competition stiffens, selecting the right virtualization technology can give decision makers a competitive advantage over their counterparts.

Gcore’s Managed Kubernetes minimizes the complexity of using containers and empowers organizations to effortlessly orchestrate containerized applications, ensuring scalability, high availability, and simplified management, all without compromising security or performance.

Explore our plans

Related Articles

How to get the size of a directory in Linux

Understanding how to check directory size in Linux is critical for managing storage space efficiently. Understanding this process is essential whether you’re assessing specific folder space or preventing storage issues.This comprehensive guide covers commands and tools so you can easily calculate and analyze directory sizes in a Linux environment. We will guide you step-by-step through three methods: du, ncdu, and ls -la. They’re all effective and each offers different benefits.What is a Linux directory?A Linux directory is a special type of file that functions as a container for storing files and subdirectories. It plays a key role in organizing the Linux file system by creating a hierarchical structure. This arrangement simplifies file management, making it easier to locate, access, and organize related files. Directories are fundamental components that help ensure smooth system operations by maintaining order and facilitating seamless file access in Linux environments.#1 Get Linux directory size using the du commandUsing the du command, you can easily determine a directory’s size by displaying the disk space used by files and directories. The output can be customized to be presented in human-readable formats like kilobytes (KB), megabytes (MB), or gigabytes (GB).Check the size of a specific directory in LinuxTo get the size of a specific directory, open your terminal and type the following command:du -sh /path/to/directoryIn this command, replace /path/to/directory with the actual path of the directory you want to assess. The -s flag stands for “summary” and will only display the total size of the specified directory. The -h flag makes the output human-readable, showing sizes in a more understandable format.Example: Here, we used the path /home/ubuntu/, where ubuntu is the name of our username directory. We used the du command to retrieve an output of 32K for this directory, indicating a size of 32 KB.Check the size of all directories in LinuxTo get the size of all files and directories within the current directory, use the following command:sudo du -h /path/to/directoryExample: In this instance, we again used the path /home/ubuntu/, with ubuntu representing our username directory. Using the command du -h, we obtained an output listing all files and directories within that particular path.#2 Get Linux directory size using ncduIf you’re looking for a more interactive and feature-rich approach to exploring directory sizes, consider using the ncdu (NCurses Disk Usage) tool. ncdu provides a visual representation of disk usage and allows you to navigate through directories, view size details, and identify large files with ease.For Debian or Ubuntu, use this command:sudo apt-get install ncduOnce installed, run ncdu followed by the path to the directory you want to analyze:ncdu /path/to/directoryThis will launch the ncdu interface, which shows a breakdown of file and subdirectory sizes. Use the arrow keys to navigate and explore various folders, and press q to exit the tool.Example: Here’s a sample output of using the ncdu command to analyze the home directory. Simply enter the ncdu command and press Enter. The displayed output will look something like this:#3 Get Linux directory size using 1s -1aYou can alternatively opt to use the ls command to list the files and directories within a directory. The options -l and -a modify the default behavior of ls as follows:-l (long listing format)Displays the detailed information for each file and directoryShows file permissions, the number of links, owner, group, file size, the timestamp of the last modification, and the file/directory name-a (all files)Instructs ls to include all files, including hidden files and directoriesIncludes hidden files on Linux that typically have names beginning with a . (dot)ls -la lists all files (including hidden ones) in long format, providing detailed information such as permissions, owner, group, size, and last modification time. This command is especially useful when you want to inspect file attributes or see hidden files and directories.Example: When you enter ls -la command and press Enter, you will see an output similar to this:Each line includes:File type and permissions (e.g., drwxr-xr-x):The first character indicates the file type- for a regular filed for a directoryl for a symbolic linkThe next nine characters are permissions in groups of three (rwx):r = readw = writex = executePermissions are shown for three classes of users: owner, group, and others.Number of links (e.g., 2):For regular files, this usually indicates the number of hard linksFor directories, it often reflects subdirectory links (e.g., the . and .. entries)Owner and group (e.g., user group)File size (e.g., 4096 or 1045 bytes)Modification date and time (e.g., Jan 7 09:34)File name (e.g., .bashrc, notes.txt, Documents):Files or directories that begin with a dot (.) are hidden (e.g., .bashrc)ConclusionThat’s it! You can now determine the size of a directory in Linux. Measuring directory sizes is a crucial skill for efficient storage management. Whether you choose the straightforward du command, use the visual advantages of the ncdu tool, or opt for the versatility of ls -la, this expertise enhances your ability to uphold an organized and efficient Linux environment.Looking to deploy Linux in the cloud? With Gcore Edge Cloud, you can choose from a wide range of pre-configured virtual machines suitable for Linux:Affordable shared compute resources starting from €3.2 per monthDeploy across 50+ cloud regions with dedicated servers for low-latency applicationsSecure apps and data with DDoS protection, WAF, and encryption at no additional costGet started today

How to Run Hugging Face Spaces on Gcore Inference at the Edge

Running machine learning models, especially large-scale models like GPT 3 or BERT, requires a lot of computing power and comes with a lot of latency. This makes real-time applications resource-intensive and challenging to deliver. Running ML models at the edge is a lightweight approach offering significant advantages for latency, privacy, and resource optimization.  Gcore Inference at the Edge makes it simple to deploy and manage custom models efficiently, giving you the ability to deploy and scale your favorite Hugging Face models globally in just a few clicks. In this guide, we’ll walk you through how easy it is to harness the power of Gcore’s edge AI infrastructure to deploy a Hugging Face Space model. Whether you’re developing NLP solutions or cutting-edge computer vision applications, deploying at the edge has never been simpler—or more powerful. Step 1: Log In to the Gcore Customer PortalGo to gcore.com and log in to the Gcore Customer Portal. If you don’t yet have an account, go ahead and create one—it’s free. Step 2: Go to Inference at the EdgeIn the Gcore Customer Portal, click Inference at the Edge from the left navigation menu. Then click Deploy custom model. Step 3: Choose a Hugging Face ModelOpen huggingface.com and browse the available models. Select the model you want to deploy. Navigate to the corresponding Hugging Face Space for the model. Click on Files in the Space and locate the Docker option. Copy the Docker image link and startup command from Hugging Face Space. Step 4: Deploy the Model on GcoreReturn to the Gcore Customer Portal deployment page and enter the following details: Model image URL: registry.hf.space/ethux-mistral-pixtral-demo:latest Startup command: python app.py Container port: 7860 Configure the pod as follows: GPU-optimized: 1x L40S vCPUs: 16 RAM: 232GiB For optimal performance, choose any available region for routing placement. Name your deployment and click Deploy.Step 5: Interact with Your ModelOnce the model is up and running, you’ll be provided with an endpoint. You can now interact with the model via this endpoint to test and use your deployed model at the edge.Powerful, Simple AI Deployment with GcoreGcore Inference at the Edge is the future of AI deployment, combining the ease of Hugging Face integration with the robust infrastructure needed for real-time, scalable, and global solutions. By leveraging edge computing, you can optimize model performance and simultaneously futureproof your business in a world that increasingly demands fast, secure, and localized AI applications. Deploying models to the edge allows you to capitalize on real-time insights, improve customer experiences, and outpace your competitors. Whether you’re leading a team of developers or spearheading a new AI initiative, Gcore Inference at the Edge offers the tools you need to innovate at the speed of tomorrow. Explore Gcore Inference at the Edge

10 Common Web Performance Mistakes and How to Overcome Them

Web performance mistakes can carry a high price, resulting in websites that yield low conversion rates, high bounce rates, and poor sales. In this article, we dig into the top 10 mistakes you should avoid to boost your website performance.1. Slow or Unreliable Web HostYour site speed begins with your web host, which provides the server infrastructure and resources for your website. This includes the VMs and other infrastructure where your code and media files reside. Three common host-related problems are as follows:Server location: The further away your server is from your users, the slower the site speed and the poorer the experience for your website visitors. (More on this under point 7.)Shared hosting: Shared hosting solutions share server resources among multiple websites, leading to slow load times and spotty connections during peak times due to heavy usage. Shared VMs can also impact your website’s performance due to increased network traffic and resource contention.VPS hosting: Bandwidth limitations can be a significant issue with VPS hosting. A limited bandwidth package can cause your site speed to decrease during high-traffic periods, resulting in a sluggish user experience.Correct for server and VM hosting issues by choosing a provider with servers located closer to your user base and provisioning sufficient computational resources, like Gcore CDN. Use virtual dedicated servers (VDS/VPS) rather than shared hosting to avoid network traffic from other websites affecting your site’s performance. If you already use a VPS, consider upgrading your hosting plan to increase server resources and improve UX. For enterprises, dedicated servers may be more suitable.2. Inefficient Code, Libraries, and FrameworksPoor-quality code and inefficient frameworks can increase the size of web pages, consume too many resources, and slow down page load times. Code quality is often affected by syntax, semantics, and logic errors. Correct these issues by writing clean and simple code.Errors or inefficiencies introduced by developers can impact site performance, such as excessive API calls or memory overuse. Prevent these issues by using TypeScript, console.log, or built-in browser debuggers during development. For bugs in already shipped code, utilize logging and debugging tools like the GNU debugger or WinDbg to identify and resolve problems.Improving code quality also involves minimizing the use of large libraries and frameworks. While frontend frameworks like React, Vue, and Angular.js are popular for accelerating development, they often include extensive JavaScript and prebuilt components that can bloat your website’s codebase. To optimize for speed, carefully analyze your use case to determine if a framework is necessary. If a static page suffices, avoid using a framework altogether. If a framework is needed, select libraries that allow you to link only the required components.3. Unoptimized Code Files and FontsEven high-quality code needs optimization before shipping. Unoptimized JavaScript, HTML, and CSS files can increase page weight and necessitate multiple HTTP requests, especially if JavaScript files are executed individually.To optimize code, two effective techniques are minification and bundling.Minification removes redundant libraries, code, comments, unnecessary characters (e.g., commas and dots), and formatting to reduce your source code’s size. It also shortens variable and function names, further decreasing file size. Tools for minification include UglifyJS for JavaScript, CSSNano for CSS, and HTMLminifier for HTML.Bundling groups multiple files into one, reducing the number of HTTP requests and speeding up site load times. Popular bundling tools include Rollup, Webpack, and Parcel.File compression using GZIP or Brotli can also reduce the weight of HTTP requests and responses before they reach users’ browsers. Enable your chosen compression technique on your server only after checking that your server provider supports it.4. Unoptimized Images and VideosSome websites are slowed down by large media files. Upload only essential media files to your site. For images, compress or resize them using tools like TinyPNG and Compressor.io. Convert images from JPEG, PNG, and GIF to WebP and AVIF formats to maintain quality while reducing file size. This is especially beneficial in industries like e-commerce and travel, where multiple images boost conversion rates. Use dynamic image optimization services like Gcore Image Stack for efficient processing and delivery. For pages with multiple images, use CSS sprites to group them, reducing the number of HTTP requests and speeding up load times.When adding video files, use lite embeds for external links. Standard embed code, like YouTube’s, is heavy and can slow down your pages. Lite embeds load only thumbnail images initially, and the full video loads when users click the thumbnail, improving page speed.5. No Lazy LoadingLazy loading delays the rendering of heavy content like images and JavaScript files until the user needs it, contrasting with “eager” loading, which loads everything at once and slows down site load times. Even with optimized images and code, lazy loading can further enhance site speed through a process called “timing.”Image timing uses the HTML loading attribute in an image tag or frameworks like Angular or React to load images in response to user actions. The browser only requests images when the user interacts with specific features, triggering the download.JavaScript timing controls when certain code loads. If JavaScript doesn’t need to run until the entire page has rendered, use the defer attribute to delay its execution. If JavaScript can load at any time without affecting functionality, load it asynchronously with the async attribute.6. Heavy or Redundant External Widgets and PluginsWidgets and plugins are placed in designated frontend and backend locations to extend website functionality. Examples include Google review widgets that publish product reviews on your website and Facebook plugins that connect your website to your Facebook Page. As your website evolves, more plugins are typically installed, and sometimes website admins forget to remove those that are no longer required.Over time, heavy and unused plugins can consume substantial resources, slowing down your website unnecessarily. Widgets may also contain heavy HTML, CSS, or JavaScript files that hinder web performance.Remove unnecessary plugins and widgets, particularly those that make cURL calls, HTTP requests, or generate excessive database queries. Avoid plugins that load heavy scripts and styles or come from unreliable sources, as they may contain malicious code and degrade website performance.7. Network IssuesYour server’s physical location significantly impacts site speed for end users. For example, if your server is in the UK and your users are in China, they’ll experience high latency due to the distance and DNS resolution time. The greater the distance between the server and the user, the more network hops are required, increasing latency and slowing down site load times.DNS resolution plays a crucial role in this process. Your authoritative DNS provider resolves your domain name to your IP address. If the provider’s server is too far from the user, DNS resolution will be slow, giving visitors a poor first impression.To optimize content delivery and reduce latency, consider integrating a content delivery network (CDN) with your server-side code. A CDN stores copies of your static assets (e.g., container images, JavaScript, CSS, and HTML files) on geographically distributed servers. This distribution ensures that users can access your content from a server closer to their location, significantly improving site speed and performance.8. No CachingWithout caching, your website has to fetch data from the origin server every time a user requests. This increases the load time because the origin server is another physical hop that data has to travel.Caching helps solve this problem by serving pre-saved copies of your website. Copies of your web files are stored on distributed CDN servers, meaning they’re available physically closer to website viewers, resulting in quicker load times.An additional type of caching, DNS caching, temporarily stores DNS records in DNS resolvers. This allows for faster domain name resolution and accelerates the initial connection to a website.9. Excessive RedirectsWebsite redirects send users from one URL to another, often resulting in increased HTTP requests to servers. These additional requests can potentially crash servers or cause resource consumption issues. To prevent this, use tools like Screaming Frog to scan your website for redirects and reduce them to only those that are absolutely necessary. Additionally, limit each redirect to making no more than one request for a .css file and one for a .js file.10. Lack of Mobile OptimizationForgetting to optimize for mobile can harm your website’s performance. Mobile-first websites optimize for speed and UX. Better UX leads to happier customers and increased sales.Optimizing for mobile starts with understanding the CPU, bandwidth, and memory limitations of mobile devices compared to desktops. Sites with excessively heavy files will load slowly on mobiles. Writing mobile-first code, using mobile devices or emulators for building and testing, and enhancing UX for various mobile device types—such as those with larger screens or higher capacity—can go a long way to optimizing for mobile.How Can Gcore Help Prevent These Web Performance Mistakes?If you’re unsure where to start in correcting or preventing web performance mistakes, don’t worry—you don’t have to do it alone. Gcore offers a comprehensive suite of solutions designed to enhance your web performance and deliver the best user experience for your visitors:Powerful VMs: Fast web hosting with a wide range of virtual machines.Managed DNS: Hosting your DNS zones and ensuring quick DNS resolution with our fast Managed DNS.CDN: Accelerate both static and dynamic components of your website for global audiences.With robust infrastructure from Gcore, you can ensure optimal performance and a seamless experience for all your web visitors. Keep your website infrastructure in one place for a simplified website management experience.Need help getting started? Contact us for a personalized consultation and discover how Gcore can supercharge your website performance.Get in touch to boost your website

How to Choose Between Bare Metal GPUs and Virtual GPUs for AI Workloads

Choosing the right GPU type for your AI project can make a huge difference in cost and business outcomes. The first consideration is often whether you need a bare metal or virtual GPU. With a bare metal GPU, you get a physical server with an entire GPU chip (or chips) installed that is completely dedicated to the workloads you run on the server, whereas a virtual GPU means you share GPU resources with other virtual machines.Read on to discover the key differences between bare metal GPUs and virtual GPUs, including performance and scalability, to help you make an informed decision.The Difference Between Bare Metal and Virtual GPUsThe main difference between bare metal GPUs and virtual GPUs is how they use physical GPU resources. With a bare metal GPU, you get a physical server with an entire GPU chip (or chips) installed that is completely dedicated to the workloads you run on the server. There is no hypervisor layer between the operating system (OS) and the hardware, so applications use the GPU resources directly.With a virtual GPU, you get a virtual machine (VM) and uses one of two types of GPU virtualization, depending on your or a cloud provider’s capabilities:An entire, dedicated GPU used by a VM, also known as a passthrough GPUA shared GPU used by multiple VMs, also known as a vGPUAlthough a passthrough GPU VM gets the entire GPU, applications access it through the layers of a guest OS and hypervisor. Also, unlike a bare metal GPU instance, other critical VM resources that applications use, such as RAM, storage, and networking, are also virtualized.The difference between running applications with bare metal and virtual GPUsThese architectural features affect the following key aspects:Performance and latency: Applications running on a VM with a virtual GPU, especially vGPU, will have lower processing power and higher latency for the same GPU characteristics than those running on bare metal with a physical GPU.Cost: As a result of the above, bare metal GPUs are more expensive than virtual GPUs.Scalability: Virtual GPUs are easier to scale than bare metal GPUs because scaling the latter requires a new physical server. In contrast, a new GPU instance can be provisioned in the cloud in minutes or even seconds.Control over GPU hardware: This can be critical for certain configurations and optimizations. For example, when training massive deep learning models with a billion parameters, total control means the ability to optimize performance optimization—and that can have a big impact on training efficiency for massive datasets.Resource utilization: GPU virtualization can lead to underutilization if the tasks being performed don’t need the full power of the GPU, resulting in wasted resources.Below is a table summarizing the benefits and drawbacks of each approach: Bare metal GPUVirtual GPUPassthrough GPUvGPUBenefitsDedicated GPU resourcesHigh performance for demanding AI workloadsLower costSimple scalabilitySuitable for occasional or variable workloadsLowest costSimple scalabilitySuitable for occasional or variable workloadsDrawbacksHigh cost compared to virtual GPUsLess flexible and scalable than virtual GPUsLow performanceNot suitable for demanding AI workloadsLowest performanceNot suitable for demanding AI workloadsShould You Use Bare Metal or Virtual GPUs?Bare metal GPUs and virtual GPUs are typically used for different types of workloads. Your choice will depend on what AI tasks you’re looking to perform.Bare metal GPUs are better suited for compute-intensive AI workloads that require maximum performance and speed, such as training large language models. They are also a good choice for workloads that must run 24/7 without interruption, such as some production AI inference services. Finally, bare metal GPUs are preferred for real-time AI tasks, such as robotic surgery or high-frequency trading analytics.Virtual GPUs are a more suitable choice for the early stages of AI/ML and iteration on AI models, where flexibility and cost-effectiveness are more important than top performance. Workloads with variable or unpredictable resource requirements can also run on this type of GPU, such as training and fine-tuning small models or AI inference tasks that are not sensitive to latency and performance. Virtual GPUs are also great for occasional, short-term, and collaborative AI/ML projects that don’t require dedicated hardware—for example, an academic collaboration that includes multiple institutions.To choose the right type of GPU, consider these three factors:Performance requirements. Is the raw GPU speed critical for your AI workloads? If so, bare metal GPUs are a superior choice.Scalability and flexibility. Do you need GPUs that can easily scale up and down to handle dynamic workloads? If yes, opt for virtual GPUs.Budget. Depending on the cloud provider, bare metal GPU servers can be more expensive than virtual GPU instances. Virtual GPUs typically offer more flexible pricing, which may be appropriate for occasional or variable workloads.Your final choice between bare metal GPUs and virtual GPUs depends on the specific requirements of the AI/ML project, including performance needs, scalability requirements, workload types, and budget constraints. Evaluating these factors can help determine the most appropriate GPU option.Choose Gcore for Best-in-Class AI GPUsGcore offers bare metal servers with NVIDIA H100, A100, and L40S GPUs. Using the 3.2 Tbps InfiniBand interface, you can combine H100 or A100 servers into scalable GPU clusters for training and tuning massive ML models or for high-performance computing (HPC).If you are looking for a scalable and low-latency solution for global AI inference, explore Gcore Inference at the Edge. It especially benefits latency-sensitive, real-time applications, such as generative AI and object recognition.Discover Gcore bare metal GPUs

How to Configure Grafana for Visualizing Kubernetes (K8s) Cluster Monitoring

Kubernetes monitoring allows you to observe your workloads and cluster resources, spot issues and failures, and efficiently manage pods and other resources. Cluster admins should prioritize tracking the performance and stability of clusters in these environments. One popular tool that can help you visualize Kubernetes monitoring is Grafana. This monitoring solution lets you display K8s metrics through interactive dashboards and real-time alerts. It seamlessly integrates with Prometheus and other data sources, providing valuable insights.Gcore Managed Kubernetes simplifies the Grafana setup process by providing a managed service that includes tools like Grafana. In this article, we’ll explain how to set up and configure Grafana to monitor Kubernetes, its key metrics, and dashboards.Setting Up Grafana for Effective Kubernetes MonitoringTo begin monitoring Kubernetes with Grafana, first, check that you have all the requirements in place: a functioning Kubernetes cluster, the Helm package manager installed, and kubectl set up to communicate with your cluster.Install Grafana in a Kubernetes Cluster. Start by adding the Grafana Helm repository.helm repo add grafana https://grafana.github.io/helm-chartshelm repo updateNext, install Grafana using Helm. This command deploys Grafana into your Kubernetes cluster:helm install grafana grafana/grafanaNow it’s time to configure Grafana for the Kubernetes environment. After installation, retrieve the admin password by using the command below:kubectl get secret --namespace default grafana -o jsonpath="{.data.admin-password}" | base64 --decode ; echoThen access the Grafana UI by port-forwarding:kubectl port-forward svc/grafana 3000:80Open your web browser and navigate to http://localhost:3000. Log in using the default username admin and the password you retrieved. Once logged in, you can configure Grafana to monitor your Kubernetes environment by adding data sources such as Prometheus and creating custom dashboards.You’ve now successfully set up Grafana for Kubernetes monitoring!Key Metrics for Kubernetes MonitoringUnderstanding metrics for Kubernetes monitoring allows you to visualize your cluster’s reliability. Key metrics are the following:Node resources. Track CPU and memory usage, disk utilization, and network bandwidth to understand resource consumption and identify bottlenecks.Cluster metrics. Monitor the number of nodes to understand resource billing and overall cluster usage, and track running pods to determine node capacity and identify failures.Pod metrics. Measure how pods are managed and deployed, including instances and deployment status, and monitor container metrics like CPU, memory, and network usage.State metrics. Keep an eye on persistent volumes, disk pressure, crash loops, and job success rates to ensure proper resource management and application stability.Container metrics. Track container CPU and memory usage relative to pod limits, and monitor network data to detect bandwidth issues.Application metrics. Measure application availability, performance, and business-specific metrics to maintain optimal user experience and operational health.Setting Up Grafana DashboardsYou can opt to design and tailor Grafana dashboards to monitor your Kubernetes cluster. This will help you better understand your systems’ performance and overall well-being at a glance.Log into Grafana. Open your web browser, go to http://localhost:3000/, and log in with the default credentials (admin for both username and password), then change your password if/when prompted.Grafana—Log In to Start MonitoringAdd data source. Navigate to Configuration and select Data Sources. Click on Add Data Source and choose the appropriate data source, such as Prometheus.Create a dashboard. Go to Create > Dashboard, click Add New Panel, choose the panel type (e.g., Time series chart, Gauge, Table), and configure it with a PromQL query and visualization settings.Adding a New Panel in Grafana DashboardOrganize and save the dashboard. Arrange panels by clicking Add Panel > Add Row and dragging panels into the desired rows. To save the dashboard, click the save icon, name it, and confirm the save.Gcore Managed Kubernetes for Kubernetes MonitoringWhether you’re getting started with monitoring Kubernetes or you’re a seasoned pro, Gcore Managed Kubernetes offers significant advantages for businesses seeking efficient and reliable Kubernetes cluster monitoring and container management:Ease of integrating Grafana: The service seamlessly integrates with Grafana, enabling effortless visualization and monitoring of performance metrics via dashboards.Automated control: Gcore Managed Kubernetes simplifies the setup and monitoring process by using automation. This service conducts health checks on your nodes, automatically updating and restarting them when needed to keep performance at its best.Enhanced security and reliability: Gcore Managed Kubernetes guarantees the management of nodes by integrating features like automatic scaling and self-repairing systems to maintain optimal performance.Discover Gcore Managed Kubernetes, including automated scaling, one-click provisioning, and Grafana integration.

TCO Comparison: Self-Managed Kubernetes vs. Managed Kubernetes Provider

Calculating the total cost of ownership (TCO) for Kubernetes requires identifying all major expenses, including infrastructure costs, personnel costs, and potential cloud provider fees. With a clear picture of TCO, you can make a more informed decision when choosing between self-managed (self-hosted) Kubernetes and a managed Kubernetes provider. The TCOs of the two approaches are significantly different, and this article will show you exactly how and why.TCO Comparison SummaryThe table below shows the key aspects of the TCO comparison between self-managed Kubernetes and managed Kubernetes providers. It compares infrastructure expenses, including provider fees, and an engineer’s salary.For this comparison, we’ll assume that a company would need only one DevOps engineer for managed Kubernetes, whereas companies opting for self-hosted Kubernetes would need three. We’ll look at rented cloud VMs for self-hosted, and out-of-the-box K8s clusters for managed Kubernetes—two standard scenarios for a fair comparison. For both scenarios, the infrastructure costs shown in the table are the average when considering AWS, Azure, Google Cloud, and Gcore. InfrastructureEngineers’ salaryTotal annual costSelf-hosted Kubernetes$13,737.64$321,500$335,238Managed Kubernetes$6,157.8$107,167$113,325As you can see, the TCO of self-hosted Kubernetes is almost three times higher than that of managed Kubernetes. Let’s explore the reasons for this major cost discrepancy.Infrastructure Cost ComparisonKubernetes is a free software. But to run it, you have to rent or buy infrastructure, such as VMs or physical servers. The way you do so differs depending on whether you opt for self-hosted or managed Kubernetes. To understand infrastructure costs, we need to take a closer look at each method in turn and explore the components required.Self-hosted KubernetesIf you choose to run K8s independently, you’ll need to rent VMs for the Kubernetes master node (the control plane) and worker nodes. Let’s consider a production-grade cluster consisting of the following:3 VMs for the control plane, required for fault tolerance2 VMs for the worker nodesFor simplicity, we choose VMs with a configuration suitable for an average web project: 8 vCPU, 16 GB RAM, and 75 GB SSD.Here is the pricing* offered by four cloud providers for VMs available in the US:ProviderVM types and resourcesTotal annual cost of five VMsAWSc6g.2xlarge—8 vCPU, 16 GB RAM, 75 GB SSD$12,273.6AzureA8 v2 series—8 vCPU, 16 GB RAM, 64 GB SSD**$17,764.2Google CloudN1 series—8 vCPU, 16 GB RAM, 75 GB SSD$16,721.33Gcoreg1 standard series—8 vCPU, 16 GB RAM, 75 GB SSD$8,191.42Average$13,737.64* Prices are for on-demand VMs; no commitment; no VAT; ingress traffic is not included.** Azure only offers fixed volume sizes for built-in storage.Managed KubernetesWith managed K8s, you don’t have to worry about renting separate VMs and setting up the Kubernetes software. You choose the VM configurations for your worker nodes, and a provider prepares them for you. The result is an out-of-the-box Kubernetes cluster.Sometimes, you also have to consider fees for control plane management (fixed) and egress traffic (consumption-based). Providers like AWS, Google Cloud, and Azure charge for this, while others—like Gcore—don’t.Here are the prices* offered by four cloud providers for similar cluster configurations in the US:ProviderControl plane managementCluster of two worker nodesTotal annual costConfigurationAnnual costAmazon EKS$8768 vCPU, 16 GB RAM, 75 GB SSD$4,909.44$5,785.44AKS (Azure)$8768 vCPU, 16 GB RAM, 64 GB SSD**$7,048.08$7,924.08GKE (Google)$876X vCPUs, X GB RAM$6,832.08$7,708.08Gcore Managed Kubernetes08 vCPU, 16 GB RAM, 75 GB SSD$3,213.6$3,213.6Average$6,157.8* Prices are for on-demand VMs; no commitment; no VAT; ingress traffic is not included.** Azure only offers fixed volume sizes for built-in storage.Engineer Cost ComparisonTo maintain a production-grade cluster for an average web project, you need:For a self-hosted K8s cluster—3 DevOps engineersFor a managed K8s cluster—1 DevOps engineerTo learn more about the technical reasons behind these calculations, read our article on the difference between managed and self-managed Kubernetes.According to Glassdoor, the median salary for a DevOps engineer is as follows:In the US: $140,000In Germany: €69,000 (or $74,333, the highest in Europe) DevOps salary in the USDevOps salary in GermanyAverage annual salarySelf-hosted Kubernetes (3 engineers)$420,000$222,999$321,500Managed Kubernetes (1 engineer)$140,000$74,333$107,167Final ComparisonHere is the final TCO comparison between self-managed Kubernetes and managed Kubernetes providers:ProvidersInfrastructureEngineers’ salaryTotal annual costBy providerAverageSelf-hosted KubernetesAWS$12,273.6$13,737.64$321,500$335,238Azure$17,764.2GCP$16,721.33Gcore$8,191.42Managed KubernetesAmazon EKS$5,785.44$6,157.8$107,167$113,325AKS (Azure)$7,924.08GKE (Google)$7,708.08Gcore Managed Kubernetes$3,213,6Summing UpPlease note that these approximate calculation probably aren’t exactly what you’ll experience. The actual numbers will depend on many factors, including:Size and complexity of your projectLocation where you hire engineers and deploy a K8s clusterChoice of providerHow you consume and scale computing resourcesHowever, the difference between the TCO of the two methods is relevant to what we got above: the total cost of ownership of self-managed Kubernetes is about three times higher than that of managed Kubernetes.The main reason is that Managed Kubernetes means a provider handles many of the most complex operations. This includes managing the underlying infrastructure and control plane, regular and security upgrades, monitoring, scaling the cluster, and, critical to production, high availability guaranteed by an SLA. With self-hosted K8s, you have to do that yourself, which means a larger infrastructure, larger team size, and higher salary costs.ConclusionUnderstanding the TCO difference between self-managed Kubernetes and a managed Kubernetes provider can help you choose a solution that is more suitable for your team and meets your budget. Kubernetes cost analysis can also help you identify areas for optimization, such as right-sizing your infrastructure or optimizing workloads for better resource utilization. However, the TCO isn’t the only aspect of choosing how to run Kubernetes: you should also consider things like the setup and maintenance responsibilities, as well as your project requirements.If you’re looking for reliable, high-performance, and scalable Kubernetes clusters, try Gcore Managed Kubernetes. We offer free cluster management with a 99.9% SLA, bare metal and GPU support for worker nodes, and free egress traffic.Explore Gcore Managed Kubernetes

Subscribe
to our newsletter

Get the latest industry trends, exclusive insights, and Gcore updates delivered straight to your inbox.