
Debugging is an integral part of software development, and with the right tools, it can be a breeze. Xdebug stands out as one of the most powerful debugging tools for PHP developers, and when paired with PhpStorm, it can drastically improve your debugging experience. In this guide, we’ll walk you through the detailed steps on how to seamlessly configure Xdebug in PhpStorm, enabling you to identify and resolve issues in your code more efficiently.
What is Xdebug?
Xdebug is an extension for PHP that provides a range of valuable development aids and features, primarily focusing on debugging capabilities. Here are the key features and benefits of Xdebug:
- Debugging. The main feature of Xdebug is its step debugger. When configured with a compatible Integrated Development Environment (IDE) like PhpStorm, NetBeans, or Visual Studio Code, developers can set breakpoints, inspect variable values, step through code, and evaluate expressions—all in real-time.
- Profiling. Xdebug offers profiling capabilities that help developers find bottlenecks in their PHP applications. The profiler outputs profiling information in a format that can be read by tools like KCacheGrind or QCacheGrind, allowing for detailed analysis of your PHP code’s execution.
- Code Coverage Analysis. This is especially useful for developers who practice test-driven development (TDD). Xdebug can show which parts of your codebase are tested by unit tests and which are not, helping ensure thorough test coverage.
- Stack Traces. Whenever an error occurs in your PHP code, Xdebug enhances the standard PHP error message by adding stack traces, which provide a more detailed context for the error.
- Code Execution Analysis. Xdebug provides insights into the time taken for script execution, memory usage, and more. This aids in understanding the performance dynamics of PHP scripts.
Xdebug is now considered an essential tool for numerous PHP developers. It provides features that streamline and elevate the development, debugging, and refinement of PHP programs. In the following section, we’ll guide you on how to integrate it with PhpStorm.
Setting up Xdebug in PhpStorm
Here’s a step-by-step guide to setting up Xdebug in PhpStorm:
#1 Install Xdebug
Depending on your OS, the installation differs. On Linux/Unix/macOS using PECL:
pecl install xdebugThis command installs Xdebug using the PHP Extension Community Library (PECL). If the ‘pecl’ command is not found, run this command:
sudo apt install php-pear
Other option for installing xdebug by using this command:
sudo apt install xdebugOn Windows: Visit the Xdebug website, locate the appropriate version for your PHP, download the DLL, and place it in your PHP extensions directory.
#2 Configure PHP to Use Xdebug
Once you’ve installed Xdebug, you need to configure PHP to use it. First, you need to find your ‘php.ini’ file by running this command:
php --iniThis command will display the location of your ‘php.ini’ file. Second, edit the ‘php.ini’ file by using this command:
nano /path/to/your/php.iniAdd the following lines:
zend_extension="/path/to/your/xdebug.so"xdebug.mode=debugxdebug.start_with_request=yesxdebug.client_port=9003Replace “/path/to/your/xdebug.so” with the path provided after the PECL installation. For older version you can use this format:
zend_extension=xdebug.soxdebug.remote_enable=1xdebug.remote_handler=dbgpxdebug.remote_mode=reqxdebug.remote_host=127.0.0.1xdebug.remote_port=9000Here’s a brief breakdown of what these settings do:
- xdebug.remote_enable=1: Enables remote debugging.
- xdebug.remote_handler=dbgp: Uses the DBGp debugging protocol.
- xdebug.remote_mode=req: Starts trying to connect to the IDE as soon as the script starts.
- xdebug.remote_host=127.0.0.1: The IP address where PhpStorm is running. 127.0.0.1 refers to the localhost.
- xdebug.remote_port=9000: The default port Xdebug tries to connect to (PhpStorm listens on this port by default).
#3 Restart Apache
After making changes to the PHP configuration, restart the Apache server:
sudo service apache2 restart#4 Configure PhpStorm
- Open PhpStorm.
- Navigate to Preferences or Settings > Languages & Frameworks > PHP.
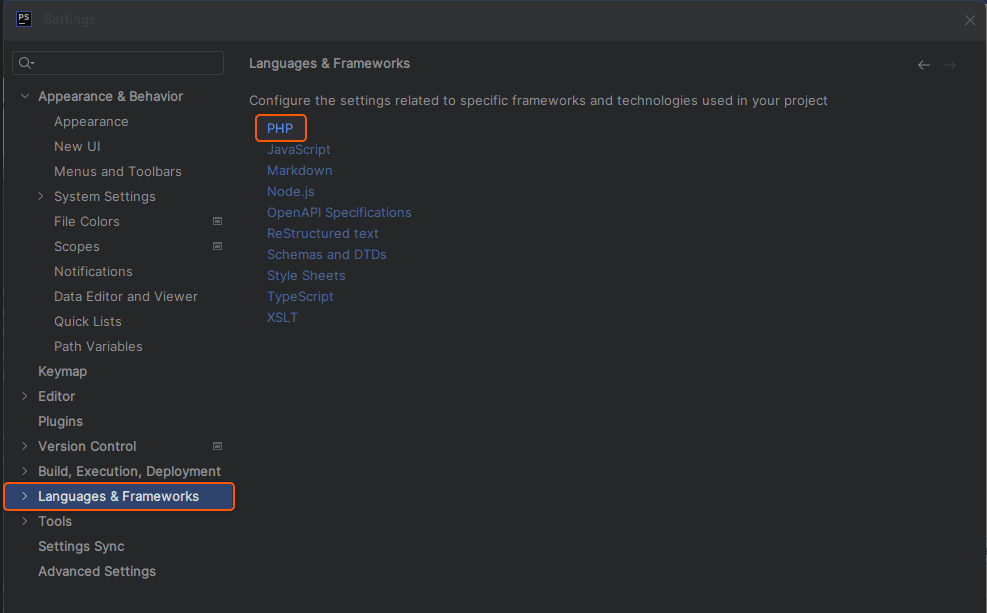
- Under the CLI Interpreter, ensure your PHP version is recognized, and Xdebug is detected.
- Go to PHP > Debug and ensure the Xdebug port is set to 9000.

If everything is correctly configured, PhpStorm will halt execution at the breakpoint, and you can begin debugging within the IDE. Remember to adjust any paths or version numbers as necessary to match your specific environment. Also, always keep a backup of configuration files before making changes.
All done! You have successfully completed the setup of Xdebug in PhpStorm. This will allow for enhanced debugging capabilities within the IDE, ensuring a more efficient development process.
Conclusion
Developing with PHP and need an efficient cloud solution? Gcore’s offerings have you covered.
- Web Application Security enhances the security of your PHP applications by protecting them from web-based threats, ensuring a secure experience for your website’s visitors.
- Managed Database for PostgreSQL provides a hassle-free database management solution, making it easier to handle data-driven operations in your PHP applications.
- Virtual Instances.
- Bare Metal offers the ultimate in server power and performance with an entire server dedicated to your needs alone.
Related articles


Subscribe to our newsletter
Get the latest industry trends, exclusive insights, and Gcore updates delivered straight to your inbox.