
Sysdig is a universal system visibility tool with support for containers. What makes Sysdig special, is that it hooks itself into the machine’s kernel and segregates the information on a per-container basis.
For the scope of this tutorial, we will focus on the open-source version of Sysdig.
In the next sections, you will:
- Install Sysdig
- Spin up a WordPress installation using
docker-compose - Use Sysdig to collect events and analyze them at a later time
- Use Sysdig to analyze data in real-time
Prerequisites
- Docker is installed on your system. For details about installing Docker, refer to the Install Docker page.
- Docker Compose is installed on your system. Refer to the Install Docker Compose page for instructions about how to install Docker Compose.
- The kernel headers are installed on the host system.
Install Sysdig
Follow these steps to install Sysdig inside a Docker container:
- In a terminal window, execute the following command to pull the Sysdig Docker image:
docker pull sysdig/sysdigUsing default tag: latestlatest: Pulling from sysdig/sysdig2967486b0658: Pull complete78101b780c72: Pull complete7e78b657334d: Pull complete650327159ca8: Pull complete47ebf73ab754: Pull completebf51ac76a6d9: Pull complete0cd11104dbf6: Pull completee6dcf17d00d8: Pull complete230d60083576: Pull completefd5ea9faf384: Pull complete6de86c8ed6e9: Pull complete8d1825f8be4b: Pull completeDigest: sha256:bbfe6953fd2b3221a8974eb13024dd33c7e78aebef8fee3d7a0d9ecdeed84ce0Status: Downloaded newer image for sysdig/sysdig:latest- Run Sysdig in a container by entering:
docker run -i -t --name sysdig --privileged -v /var/run/docker.sock:/host/var/run/docker.sock -v /dev:/host/dev -v /proc:/host/proc:ro -v /boot:/host/boot:ro -v /lib/modules:/host/lib/modules:ro -v /usr:/host/usr:ro sysdig/sysdig* Setting up /usr/src links from host* Unloading sysdig-probe, if present* Running dkms install for sysdigError! echoYour kernel headers for kernel 3.10.0-957.12.2.el7.x86_64 cannot be found at/lib/modules/3.10.0-957.12.2.el7.x86_64/build or /lib/modules/3.10.0-957.12.2.el7.x86_64/source.* Running dkms build failed, couldn't find /var/lib/dkms/sysdig/0.26.4/build/make.log* Trying to load a system sysdig-probe, if present* Trying to find precompiled sysdig-probe for 3.10.0-957.12.2.el7.x86_64Found kernel config at /host/boot/config-3.10.0-957.12.2.el7.x86_64* Trying to download precompiled module from https://s3.amazonaws.com/download.draios.com/stable/sysdig-probe-binaries/sysdig-probe-0.26.4-x86_64-3.10.0-957.12.2.el7.x86_64-82e2ae1fb159132636f7b50a762f20ef.koDownload succeeded, loading moduleroot@7b14a23f22eb:/#A few things to note about the above command:
- The
-iflag keeps STDIN open. - The
--privilegedparameter provides access to all devices on the host. Also it sets SELinux to allow the processes running inside of the container the same access to the host as a process running on the host. - The
-vflag specifies the list of files (on the host) that Sysdig can access.
Spin Up a WordPress Installation
In this section, you will install WordPress using the docker-compose command.
- In a new terminal window, move into your projects directory and type the following commands:
mkdir wordpress-sysdig && cd wordpress-sysdig- Create a file called
docker-composewith the following content:
version: '3.3'services: db: image: mysql:5.7 volumes: - db_data:/var/lib/mysql restart: always environment: MYSQL_ROOT_PASSWORD: somewordpress MYSQL_DATABASE: wordpress MYSQL_USER: wordpress MYSQL_PASSWORD: wordpress wordpress: depends_on: - db image: wordpress:latest ports: - "8000:80" restart: always environment: WORDPRESS_DB_HOST: db:3306 WORDPRESS_DB_USER: wordpress WORDPRESS_DB_PASSWORD: wordpress WORDPRESS_DB_NAME: wordpressvolumes: db_data: {}- Run the
docker-compose upcommand in detached mode with:
docker-compose up -dCreating network "wordpress-sysdig_default" with the default driverCreating volume "wordpress-sysdig_db_data" with default driverPulling wordpress (wordpress:latest)...latest: Pulling from library/wordpress8ec398bc0356: Pull complete85cf4fc86478: Pull complete970dadf4ccb6: Pull complete8c04561117a4: Pull completed6b7434b63a2: Pull complete83d8859e9744: Pull complete9c3d824d0ad5: Pull complete9e316fd5b3b3: Pull complete578b40496c37: Pull complete814ae7711d3c: Pull complete4896fed78b6b: Pull completee74d71e9611d: Pull complete46017765526c: Pull complete280386098458: Pull completef32eb0d8c540: Pull complete5c47b9ea747a: Pull completeecda5b7aad12: Pull complete84256a6b6b44: Pull complete35d4f385efb7: Pull completebf697c2ae701: Pull completed054b015f084: Pull completeDigest: sha256:73e8d8adf491c7a358ff94c74c8ebe35cb5f8857e249eb8ce6062b8576a01465Status: Downloaded newer image for wordpress:latestCreating wordpress-sysdig_db_1 ... doneCreating wordpress-sysdig_wordpress_1 ... done- You can verify the status of your containers with:
docker psIf all is going well, you should see something similar to the following output:
CONTAINER ID IMAGE COMMAND CREATED STATUS PORTS NAMESf390eec29f52 wordpress:latest "docker-entrypoint.s…" About a minute ago Up About a minute 0.0.0.0:8000->80/tcp wordpress-sysdig_wordpress_1a844840626d8 mysql:5.7 "docker-entrypoint.s…" About a minute ago Up About a minute 3306/tcp, 33060/tcp wordpress-sysdig_db_17b14a23f22eb sysdig/sysdig "/docker-entrypoint.…" 13 minutes ago Up 13 minutes sysdig- Now WordPress is up and running. Point your browser to
http://localhost:8000
to start the installation wizard:

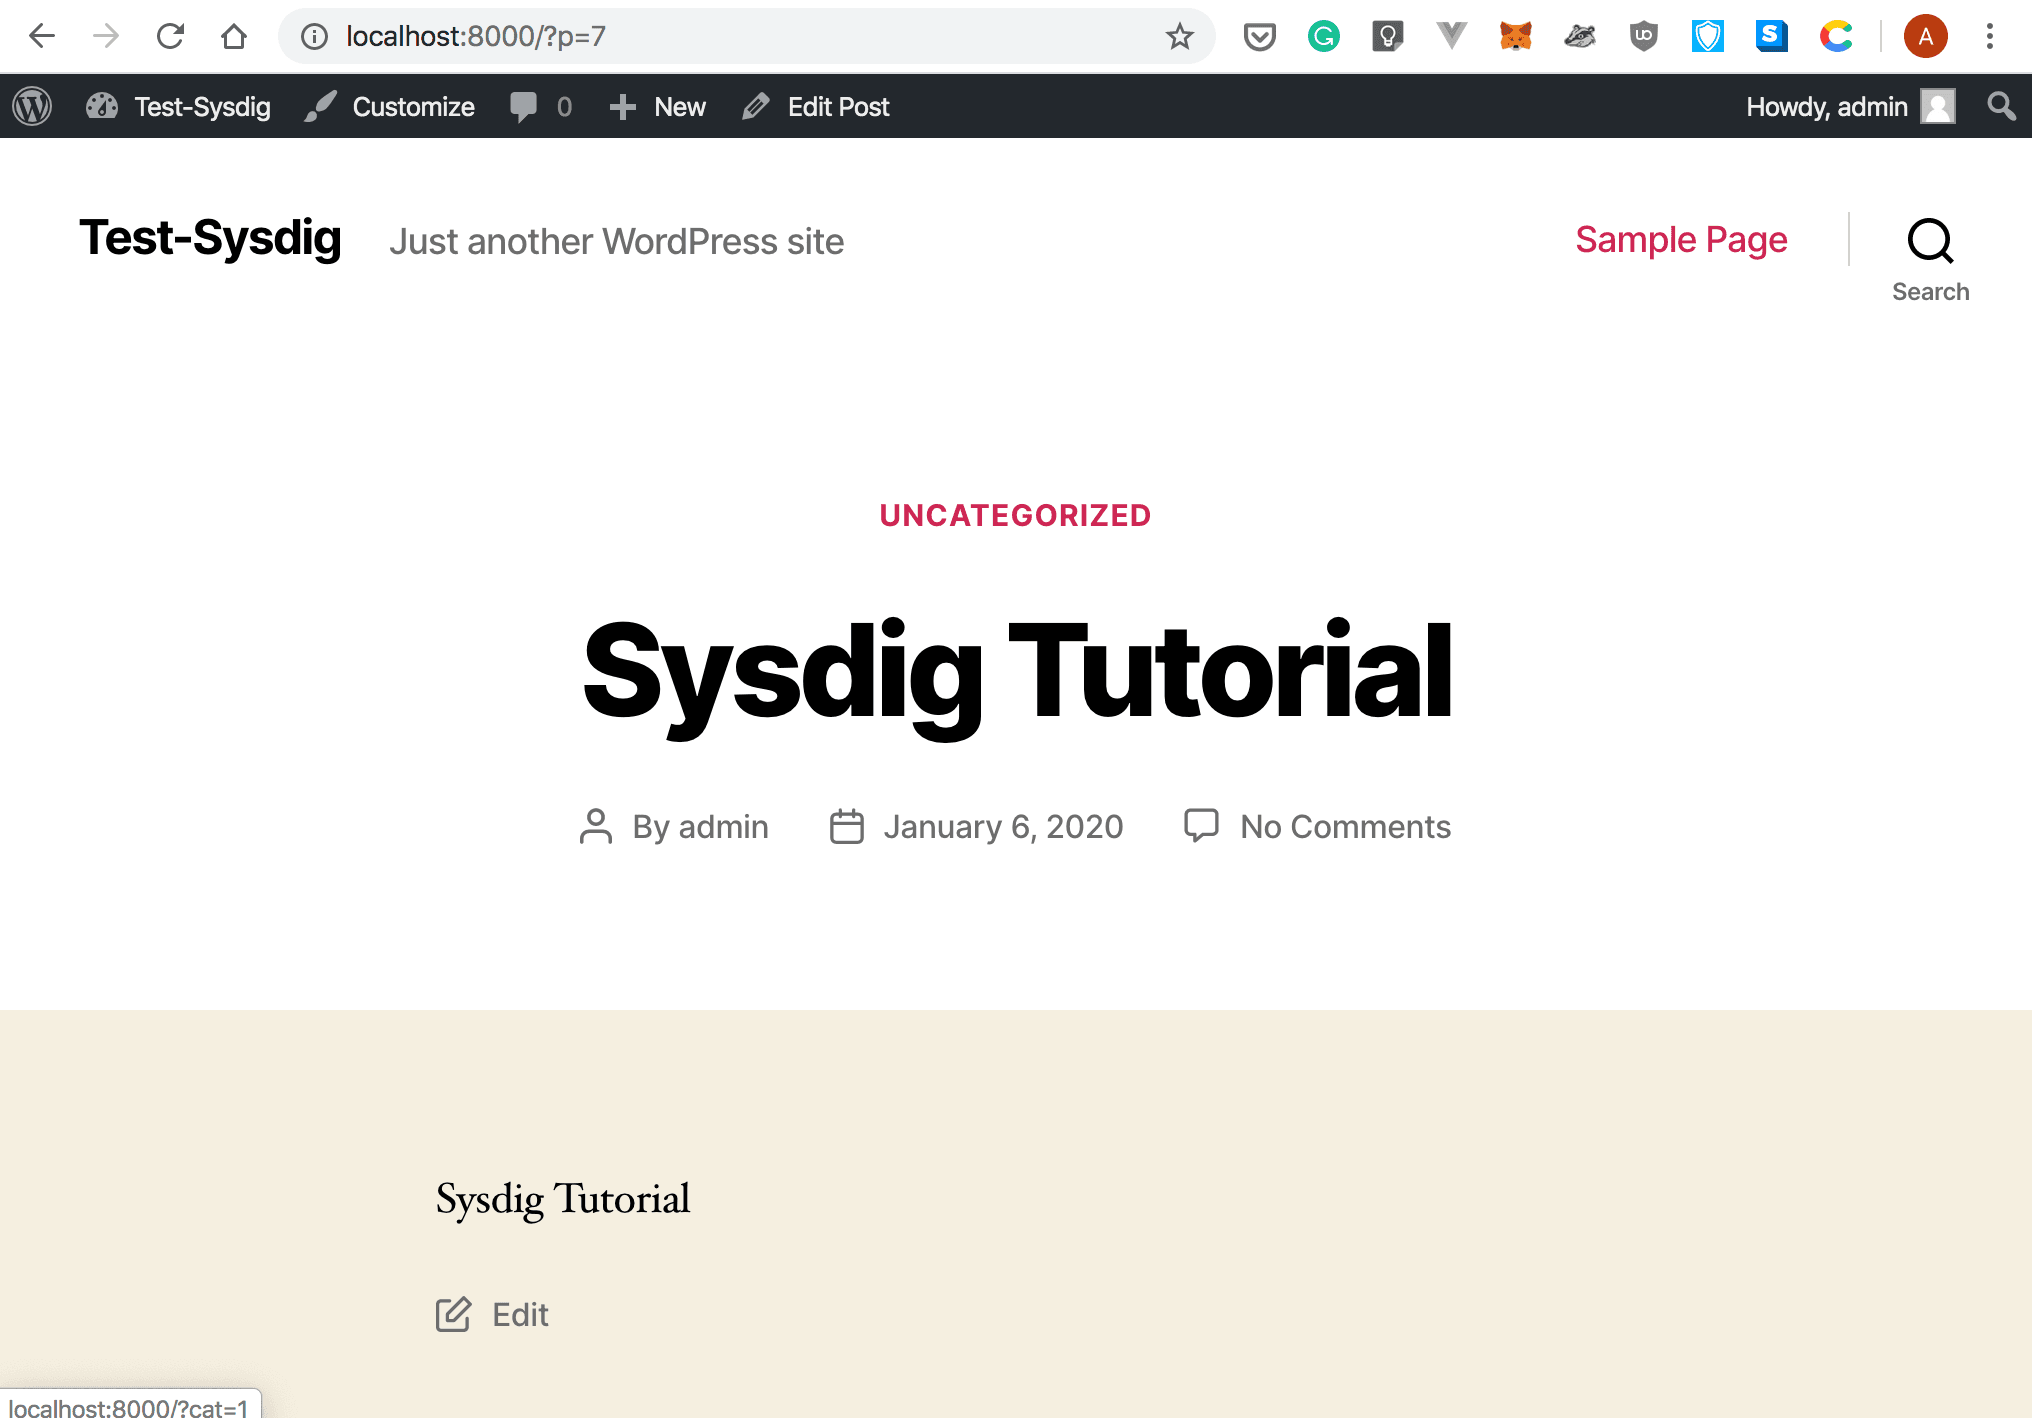
- Once the installation wizard is finished, let us go ahead and create a sample post:
Collecting Data to a File
In this section, we’ll show how you can use Sysdig to collect events and analyze them at a later time.
- To dump all captured events to a file, move to the Sysdig container, and enter the following command:
sysdig -w monitoring-wordpress.scap- In a new terminal window, use
abto make 10000 requests with a maximum of 100 requests running concurrently:
ab -n 1000 -c 100 http://localhost:8000/?p=7This is ApacheBench, Version 2.3 <$Revision: 1430300 $>Copyright 1996 Adam Twiss, Zeus Technology Ltd, http://www.zeustech.net/Licensed to The Apache Software Foundation, http://www.apache.org/Benchmarking localhost (be patient)Completed 100 requestsCompleted 200 requestsCompleted 300 requestsCompleted 400 requestsCompleted 500 requestsCompleted 600 requestsCompleted 700 requestsCompleted 800 requestsCompleted 900 requestsCompleted 1000 requestsFinished 1000 requestsNote that the above output was truncated for brevity.
- Move back to tour Sysdig container and stop capturing data by entering “CTRL+C”.
Analyzing data
Now, if you look at the size of the monitoring-wordpress.scap file, you’ll notice that Sysdig captured no less than 80M of data:
ls -lh monitoring-wordpress.scap-rw-r--r--. 1 root root 80M Jan 7 16:28 monitoring-wordpress.scapTo find your way through this mountain of data, you’ll use something called a chisel.
A chisel is basically a Lua script that analyzes the event stream and performs useful actions.
You can run the following command to display the list of chisels:
sysdig -clCategory: Application---------------------httplog HTTP requests loghttptop Top HTTP requestsmemcachelog memcached requests logCategory: CPU Usage-------------------spectrogram Visualize OS latency in real time.subsecoffset Visualize subsecond offset execution time.topcontainers_cpu Top containers by CPU usagetopprocs_cpu Top processes by CPU usageCategory: Errors----------------topcontainers_error Top containers by number of errorstopfiles_errors Top files by number of errorstopprocs_errors top processes by number of errorsNote that the above output was truncated for brevity.
To retrieve detailed information about a chisel, run the sysdig command followed by the -i flag and the name of the chisel, as in the following example:
sysdig -i httptopCategory: Application---------------------httptop Top HTTP requestsShow top HTTP requests by: ncalls, time or bytesArgs:[string] by - Show top HTTP transactions by: ncalls, time or by tes, default is ncallsContinuing our example, here’s how you can use the httptop chisel to display the top HTTP requests:
sysdig -r monitoring-wordpress.scap -c httptopncalls method url--------------------------------------------------------------------------------2001 GET localhost:8000/?p=714 OPTIONS *2 GET localhost:8000/favicon.ico1 GET /wp-content/themes/twentytwenty/assets/fonts/inter/Inter-upright-var.woff21 GET localhost/v1.24/containers/6bd8418eb03f/json1 GET localhost/v1.24/containers/06def7875617/json1 GET /v1.24/images/1b1624b63467ec61fab209b6be6e79707ae786df86607b9474b246acd316001 GET /v1.24/images/db39680b63ac47a1d989da7b742f7b382af34d85a68214f8977bad59c059011 GET localhost:8000/You can see the same information in a container-friendly format with the -pcontainer flag:
sysdig -r monitoring-wordpress.scap -c httptop -pcontainerncalls container method url--------------------------------------------------------------------------------1000 wordpress-sysdig_wo GET localhost:8000/?p=71000 host GET localhost:8000/?p=743 wordpress-sysdig_wo OPTIONS *1 sysdig GET /v1.24/images/1b1624b63467ec61fab209b6be6e79707ae786df86607b9474b246acd316001 sysdig GET localhost/v1.24/containers/06def7875617/json1 sysdig GET localhost/v1.24/containers/cd06093b141b/json1 sysdig GET /v1.24/images/00e230fe24da9067f9b6e65cfbe9935a5affac1ae8e44edb6a5b0ccc26374d1 sysdig GET /v1.24/images/db39680b63ac47a1d989da7b742f7b382af34d85a68214f8977bad59c05901Digging Deeper
Sysdig captures content-rich information that lets you get detailed insights into the inner-workings of your containers. Let’s suppose you’re running a few containers and want to know which process consumes the most CPU.
- List the containers that were active during the period in which you captured events:
sysdig -r monitoring-wordpress.scap -c lscontainers- You can identify the container that consumed the most CPU with:
sysdig -r monitoring-wordpress.scap -c topcontainers_cpuCPU% container.name--------------------------------------------------------------------------------5.37% wordpress-sysdig_wordpress_11.35% wordpress-sysdig_db_10.84% host0.51% sysdig- You can dig even deeper and identify the most CPU intensive process with the
topprocs_cpuchisel:
sysdig -r monitoring-wordpress.scap -c topprocs_cpu container.name contains wordpress_1CPU% Process PID--------------------------------------------------------------------------------0.12% apache2 83830.11% apache2 94130.11% apache2 93000.11% apache2 92420.11% apache2 88970.11% apache2 84220.10% apache2 93720.10% apache2 92410.10% apache2 84240.09% apache2 9429If you want to see more details, the ps chisel provides a more verbose alternative:
sysdig -r monitoring-wordpress.scap -c ps container.name=wordpress-sysdig_wordpress_1TID PID USER VIRT RES FDLIMIT CMD5896 5896 root 232.82M 22.32M 429496729 apache28383 8383 www-data 307.44M 25.46M 429496729 apache28422 8422 www-data 235.44M 22.90M 429496729 apache28424 8424 www-data 307.44M 25.46M 429496729 apache28897 8897 www-data 235.44M 22.89M 429496729 apache29154 9154 www-data 235.44M 22.91M 429496729 apache29241 9241 www-data 307.44M 25.66M 429496729 apache29242 9242 www-data 307.44M 25.67M 429496729 apache29300 9300 www-data 235.44M 22.89M 429496729 apache29372 9372 www-data 235.44M 22.89M 429496729 apache29413 9413 www-data 233.44M 20.77M 429496729 apache2Useful Tips
If you run Sysdig to capture events as in the above example (sysdig -w monitoring-wordpress.scap), the event file will grow continuously until it consumes all the available space. There are a few methods that can help prevent this from happening:
- Specify the number of events Sysdig should capture by passing it the
-nflag. Once Sysdig captures the specified number of events, it’ll automatically exit:
sysdig -n 5000 -w monitoring-wordpress.scap- Use the
-Cflag to configure Sysdig so that it breaks the capture into smaller files of a specified size. The following example continuously saves events to files < 10MB:
sysdig -C 10 -w monitoring-wordpress.scapThis will create a bunch of files no larger than 10 MB:
ls -lh monitoring-wordpress*-rw-r--r--. 1 root root 9.6M Jan 7 17:13 monitoring-wordpress.scap0-rw-r--r--. 1 root root 9.6M Jan 7 17:14 monitoring-wordpress.scap1-rw-r--r--. 1 root root 9.6M Jan 7 17:14 monitoring-wordpress.scap2-rw-r--r--. 1 root root 9.6M Jan 7 17:14 monitoring-wordpress.scap3-rw-r--r--. 1 root root 9.6M Jan 7 17:14 monitoring-wordpress.scap4-rw-r--r--. 1 root root 9.6M Jan 7 17:14 monitoring-wordpress.scap5-rw-r--r--. 1 root root 9.6M Jan 7 17:14 monitoring-wordpress.scap6-rw-r--r--. 1 root root 9.6M Jan 7 17:14 monitoring-wordpress.scap7-rw-r--r--. 1 root root 6.4M Jan 7 17:14 monitoring-wordpress.scap8- Specify the maximum number of files Sysdig should keep with the
-Wflag. For example, you can combine the-Cand-Wflags like so:
sysdig -C 10 -W 4 -w monitoring-wordpress.scapThe above command will only keep the last four capture files:
ls -lh monitoring-wordpress*-rw-r--r--. 1 root root 7.2M Jan 7 17:21 monitoring-wordpress.scap0-rw-r--r--. 1 root root 9.6M Jan 7 17:21 monitoring-wordpress.scap1-rw-r--r--. 1 root root 9.6M Jan 7 17:21 monitoring-wordpress.scap2-rw-r--r--. 1 root root 9.6M Jan 7 17:21 monitoring-wordpress.scap3root@cd06093b141b:/# sysdig -C 10 -W 4 -w monitoring-wordpress.scapReal-Time Monitoring
With Sysdig, you can also analyze data real-time. At first glance, this can seem like a daunting task because, by default, all events are continuously printed out to the console. Fortunately, chisels are here to help.
Let’s take an example.
Analyze Processes on a Per Container Basis
- Run the following command to list your containers:
docker psCONTAINER ID IMAGE COMMAND CREATED STATUS PORTS NAMES5b253e74e8e7 sysdig/sysdig "/docker-entrypoint.…" 9 minutes ago Up 9 minutes sysdig06def7875617 wordpress:latest "docker-entrypoint.s…" 3 hours ago Up 3 hours 0.0.0.0:8000->80/tcp wordpress-sysdig_wordpress_16bd8418eb03f mysql:5.7 "docker-entrypoint.s…" 3 hours ago Up 3 hours 3306/tcp, 33060/tcp wordpress-sysdig_db_1- You can analyze the processes running in the WordPress container with:
sysdig -pc -c topprocs_cpu container.name=wordpress-sysdig_wordpress_1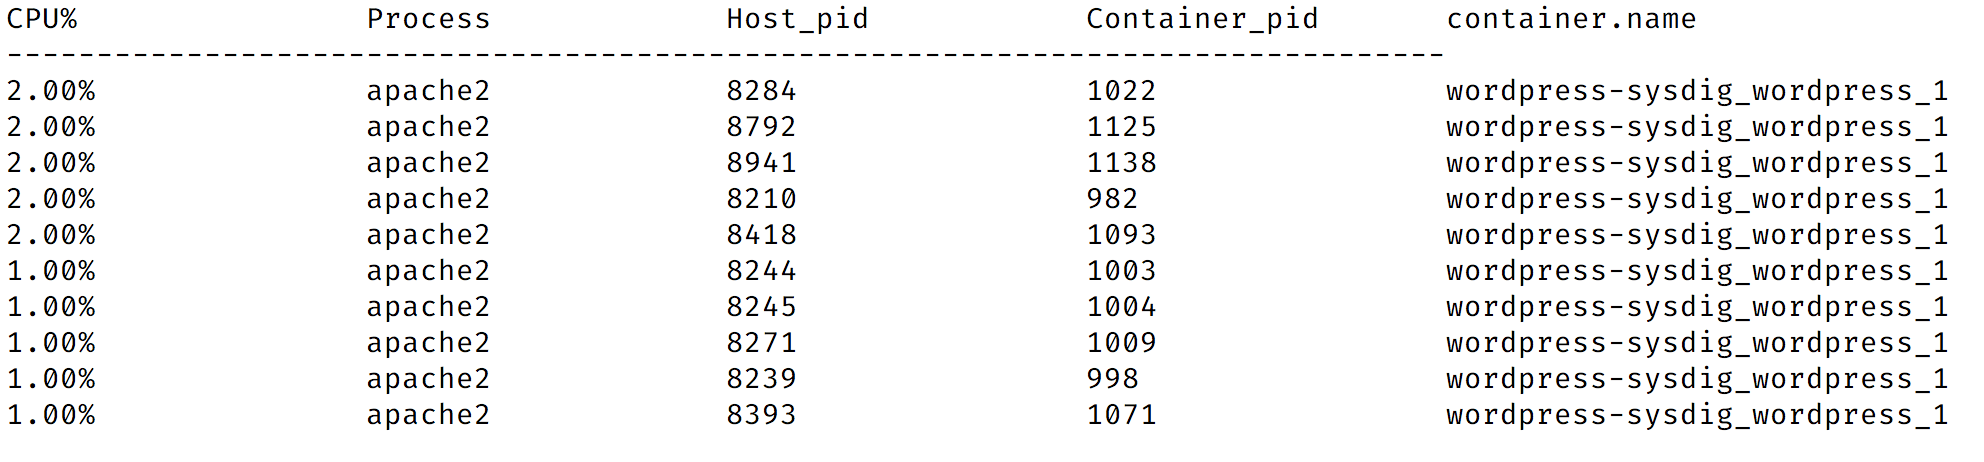
- Similarly, you can analyze the processes running in the MySQL container:
sysdig -pc -c topprocs_cpu container.name=wordpress-sysdig_db_1
Note that, not much different from this example, Sysdig can monitor network traffic, disk usage, and so on.
In this tutorial, you have gone over the fundamentals of using Sysdig to get a clear understanding of the activity generated by your containers. The examples in this blog post helped you get started and, in future tutorials, we’ll show you how to use Csysdig and Sysdig Inspect.
Related articles


Imagine discovering that migrating your company's data to a new cloud provider will cost hundreds of thousands of dollars in egress fees alone, before you've even touched the re-engineering work. Or worse, picture being in Synapse Financial

Subscribe to our newsletter
Get the latest industry trends, exclusive insights, and Gcore updates delivered straight to your inbox.