Radar has landed - discover the latest DDoS attack trends. Get ahead, stay protected.Get the report
Under attack?

Products

Solutions

Resources

Partners

Why Gcore

  1. Home
  2. Developers
  3. What Is Autoscaling? | How Does Autoscaling Work?

What Is Autoscaling? | How Does Autoscaling Work?

  • By Gcore
  • July 26, 2023
  • 9 min read
What Is Autoscaling? | How Does Autoscaling Work?

An application’s success can also be its downfall if it’s not able to work effectively at scale with thousands of daily users. If your application infrastructure capacity is initially set too low, you will need to redesign and reimplement your system when your application’s popularity grows in order to handle the increased traffic. This is why your application’s autoscaling capability is crucial. With autoscaling, your application’s server resources can be increased automatically to meet the growing number of user requests. If there are fewer requests, the server resources will instead be decreased, allowing you to optimize the cost of your infrastructure. In this article, we’ll explain what autoscaling is, how it works, and why and how you can effectively and easily apply autoscaling to your future applications.

What Is Autoscaling?

Autoscaling is a feature that allows your applications to adapt to different numbers of user requests automatically. If user requests are low, your server resources are automatically reduced to save costs. If the number of requests increases, resources are automatically added to your application server to handle requests efficiently.

With traditional infrastructure management, if you notice a lot of user requests, you need to increase the application servers’ resources by scaling them manually. This is not an easy task since your app may contain many system components; while you’re scaling the servers, your users will experience significant downtime. After you have increased the resources for your servers, there may be times when the number of user requests is lower, such as on weekdays or in the middle of the night. Constantly running your application servers at high capacity is not cost-efficient.

Types of Autoscaling

There are two types of autoscaling:

  • Vertical autoscaling
  • Horizontal autoscaling

Let’s look at each in turn.

Vertical Autoscaling

With vertical autoscaling, the size of your server is automatically increased as more resources are needed. Take a blog service as an example. To handle more API requests from users, the size of the server that hosts your PostgreSQL database needs to increase by adding more CPUs, RAM, and disks.

Vertical scaling a PostgreSQL database

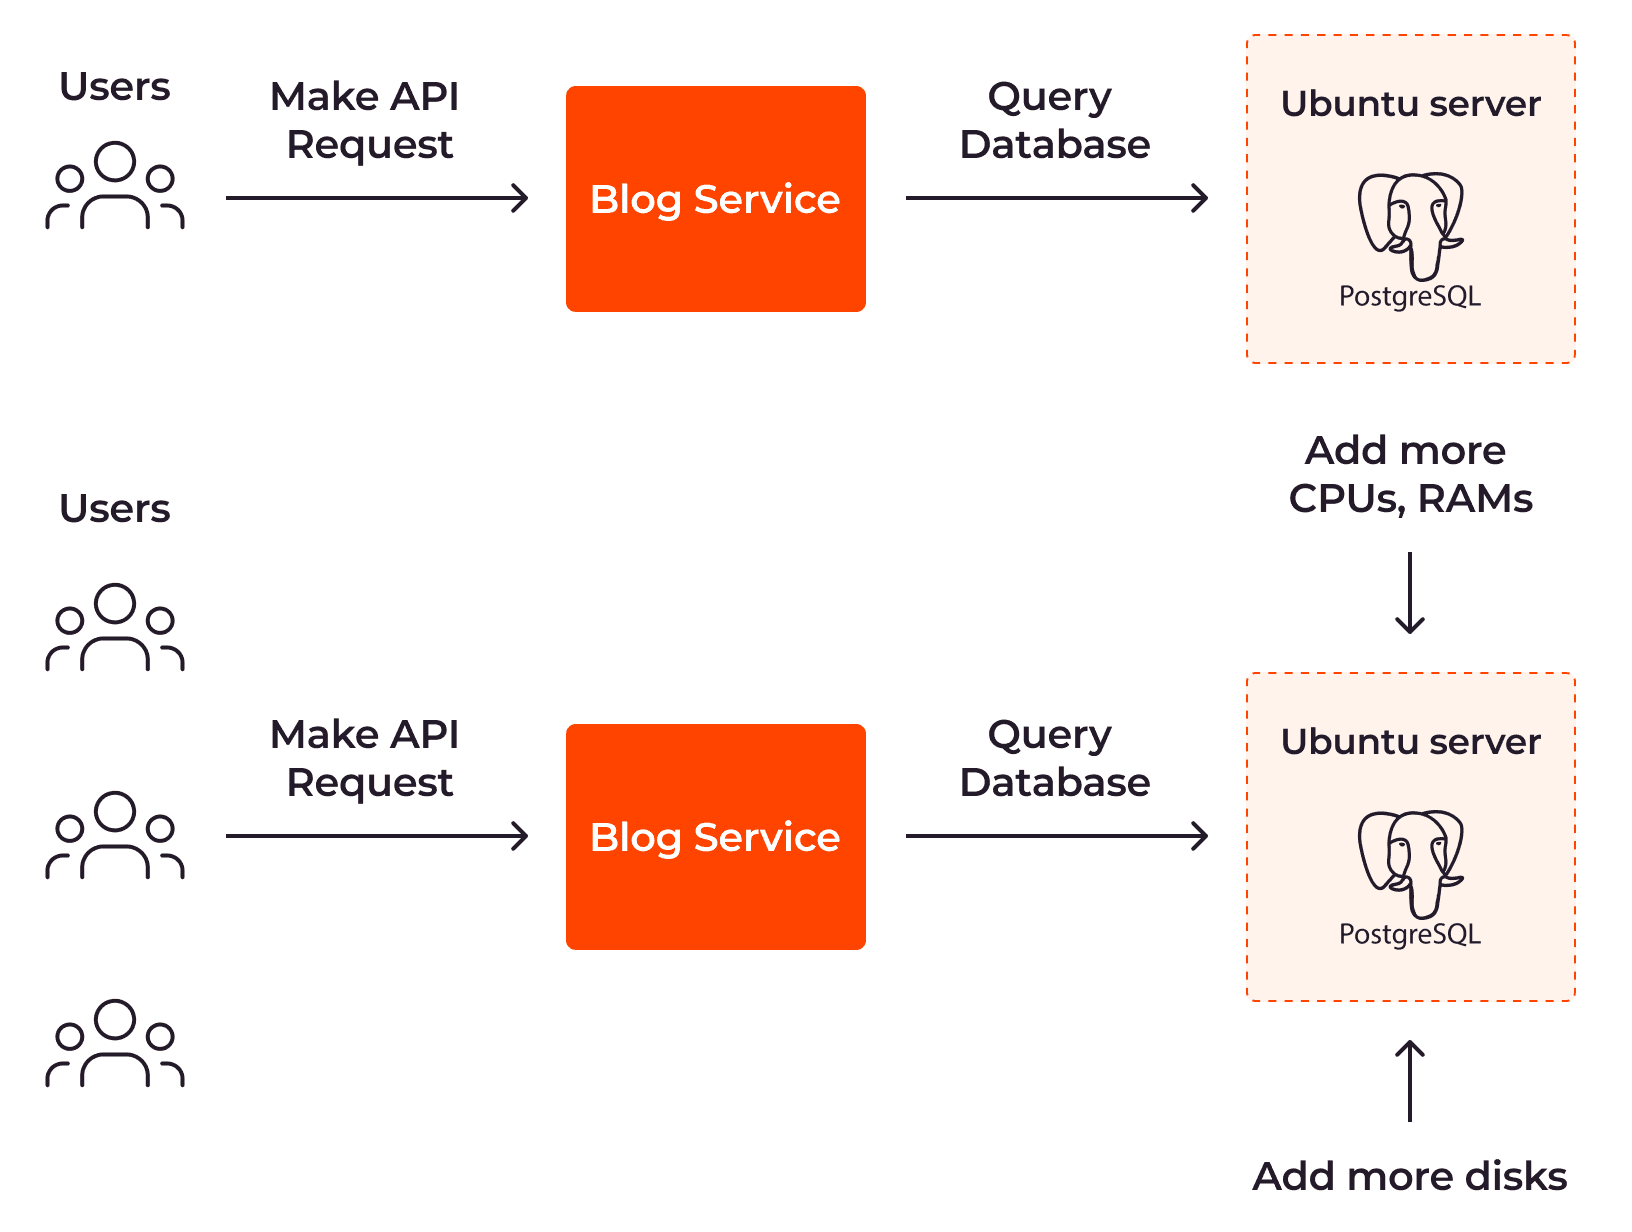
We often use the terms “scale up” and “scale down” when talking about vertical scalability. When scaling up, your resources are increased so that they have more memory or more CPUs to handle more requests. When scaling down, your resources contract to use less memory or fewer CPUs to reduce the cost.

Vertical autoscaling is usually applied to centralized systems, because they are not designed to be distributed across multiple instances. They typically run on a single or tightly coupled group of instances, which makes it difficult to apply horizontal autoscaling.

Horizontal Autoscaling

With horizontal autoscaling, the number of servers is updated automatically and responsively. With this approach, a PostgreSQL node is added to handle the growing number of user requests.

Horizontal scaling a PostgreSQL database that uses a PostgreSQL cluster

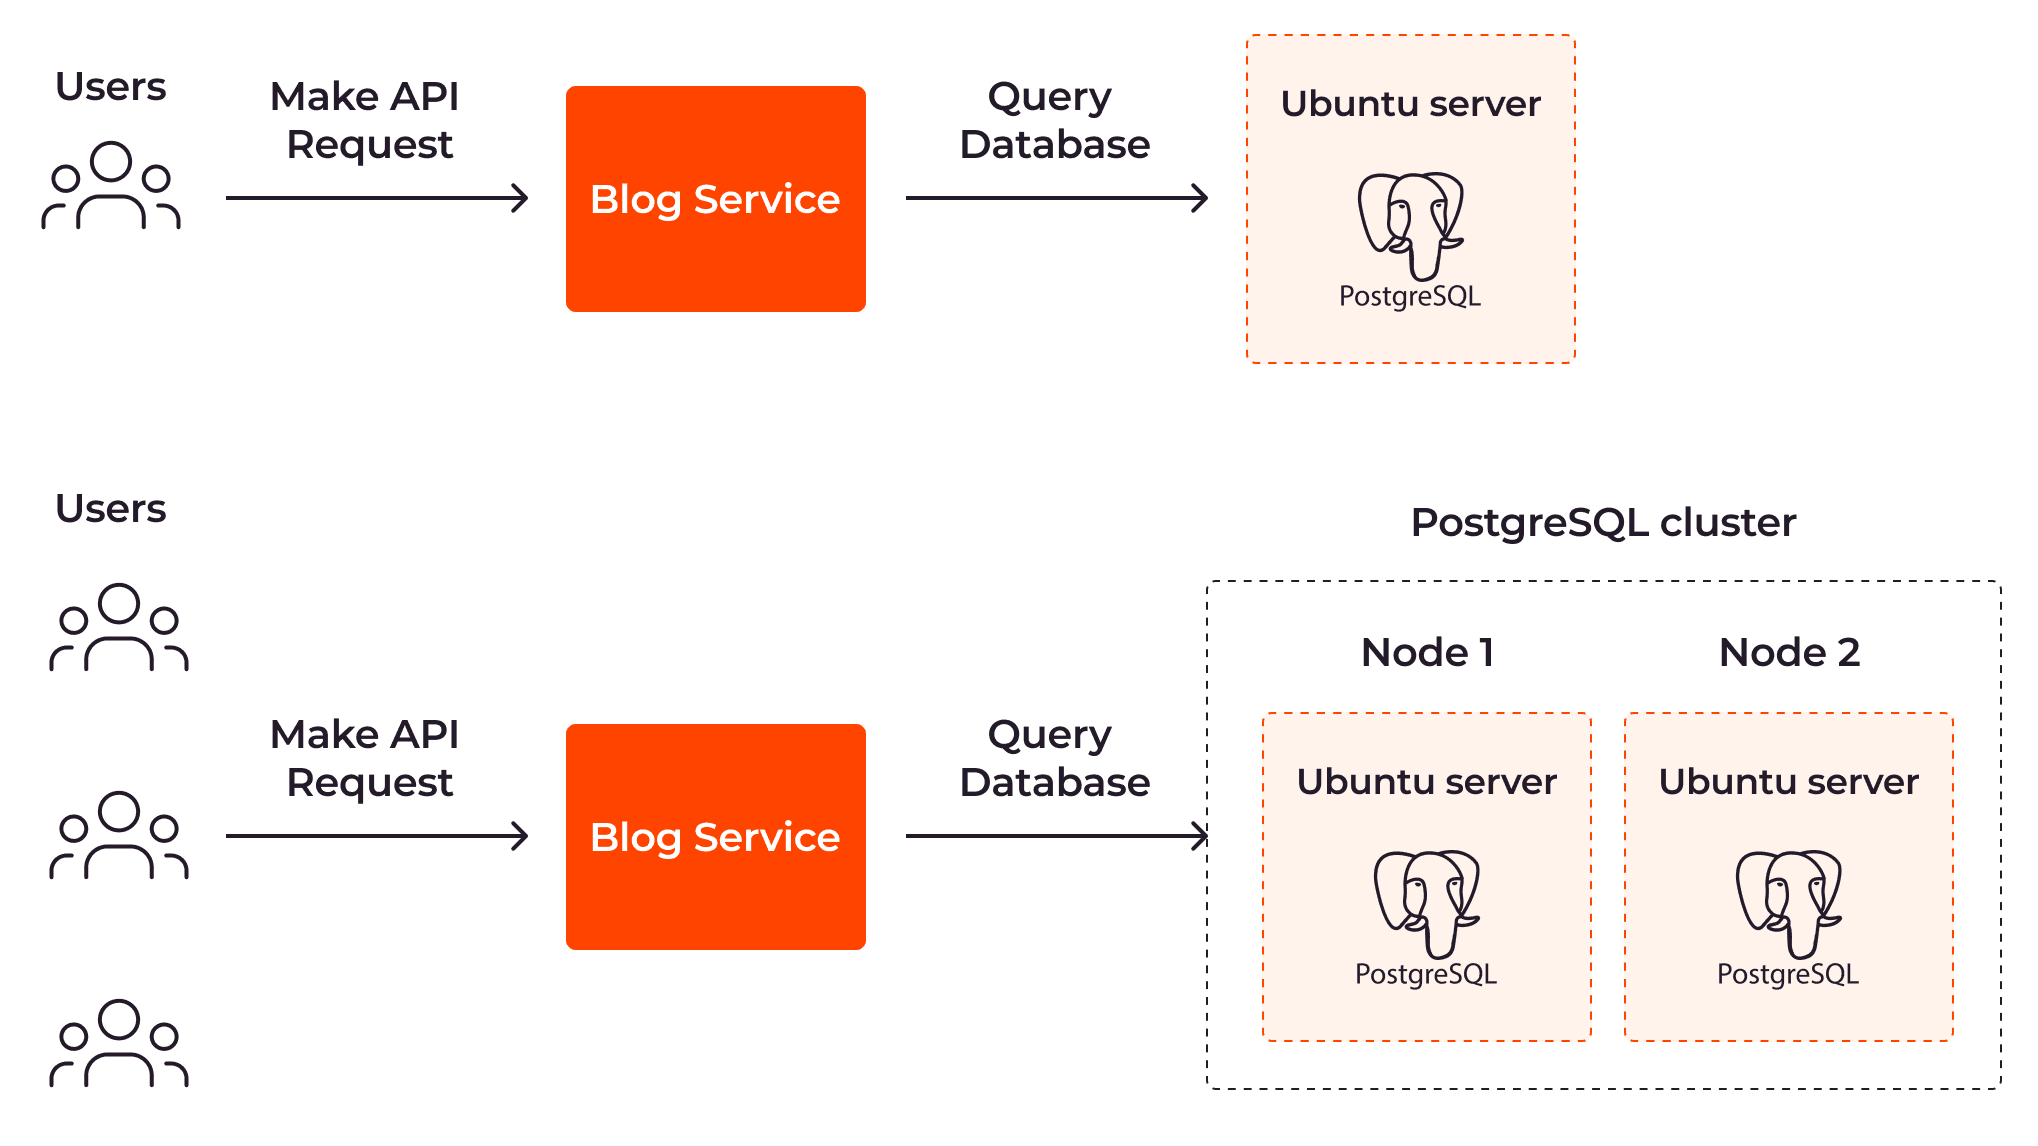
The terms “scale out” and “scale in” are used to refer to horizontal scalability. When scaling out, more instances of your resources are created; when scaling in, existing instances are removed.

Horizontal autoscaling is often applied to distributed systems. Distributed systems are designed to make working with multiple instances in different geographic distributions more efficient. Applying horizontal autoscaling to distributed systems allows them to be scaled efficiently and enhances fault tolerance by spreading the workload across multiple nodes.

How Does Autoscaling Work?

Autoscaling works by dynamically adjusting the server resources according to the current workload generated by users.

How autoscaling works

To apply autoscaling, there are a number of tasks involved, including monitoring the servers, triggering the autoscaling, and load balancing user traffic. Let’s break down these tasks to understand how autoscaling works behind the scenes.

Monitoring

Autoscaling uses monitoring tools to continuously collect server metrics such as CPU optimization, memory usage, response time, or network traffic. Each metric has its advantages and disadvantages. For example, CPU optimization data is easy to collect and usually indicates workload intensity. However, this metric is not sufficient for services that use many graphic cards, such as modeling, in which case both GPU optimization and CPU optimization should be monitored. Therefore, the autoscaling mechanism should be applied based on a group of different metrics, instead of depending solely on one.

Triggering

Autoscaling triggers the scaling process differently based on the autoscaling method in place (more on this in the Autoscaling Methods section,) whether through predefined schedules, alerts, or events. If you’re using scheduled autoscaling, it will trigger the scale of the application according to the predefined schedule. If you’re using reactive autoscaling and the thresholds for server metrics are breached, an alert will be created to initiate the scaling process. If you use predictive autoscaling—the autoscaling method that uses AI or machine learning services to identify whether the application needs more resources—an event will be created to trigger the scaling task instead.

Adjusting

Depending on the platform you’re using, the component responsible for adjusting server resources is different. Let’s take Kubernetes as an example. With Kubernetes, to autoscale the pods horizontally, the horizontal pod autoscaling controller (part of the Kubernetes control plane) adjusts the number of pods to handle the application workload. To apply autoscaling to the pods vertically, the vertical pod autoscaling controller inside the Kubernetes control plane adjusts the CPU number and memory size for the current pod instead.

Read: What Is a Kubernetes Cluster?
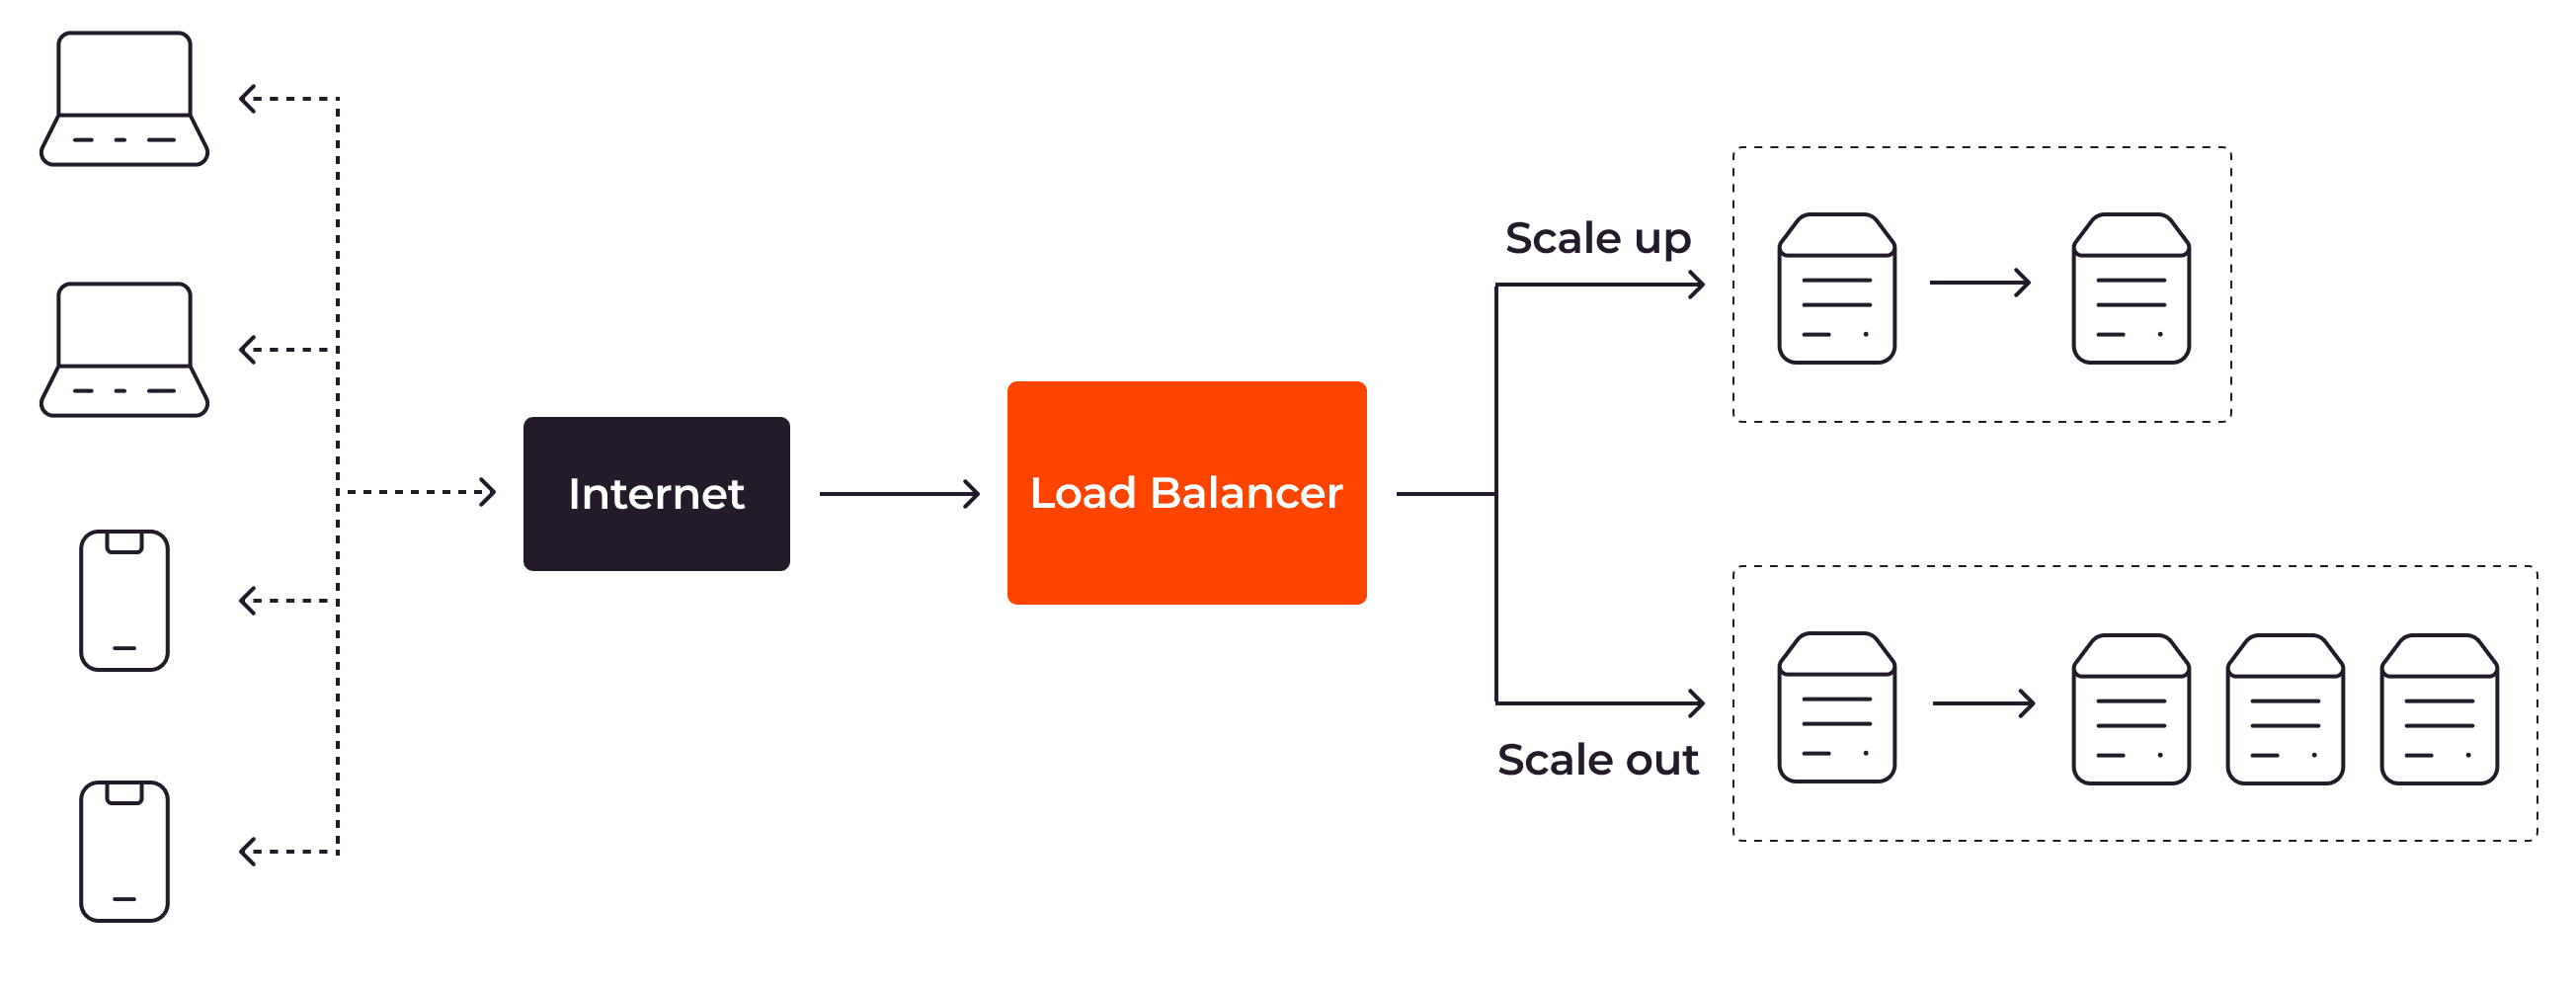
Load Balancing

User requests are distributed by the load balancer across multiple server instances according to certain rules. This prevents any single server from being overwhelmed.

Autoscaling Methods

There are three methods for applying autoscaling to your app: scheduled autoscaling, reactive autoscaling, and predictive autoscaling.

Scheduled Autoscaling

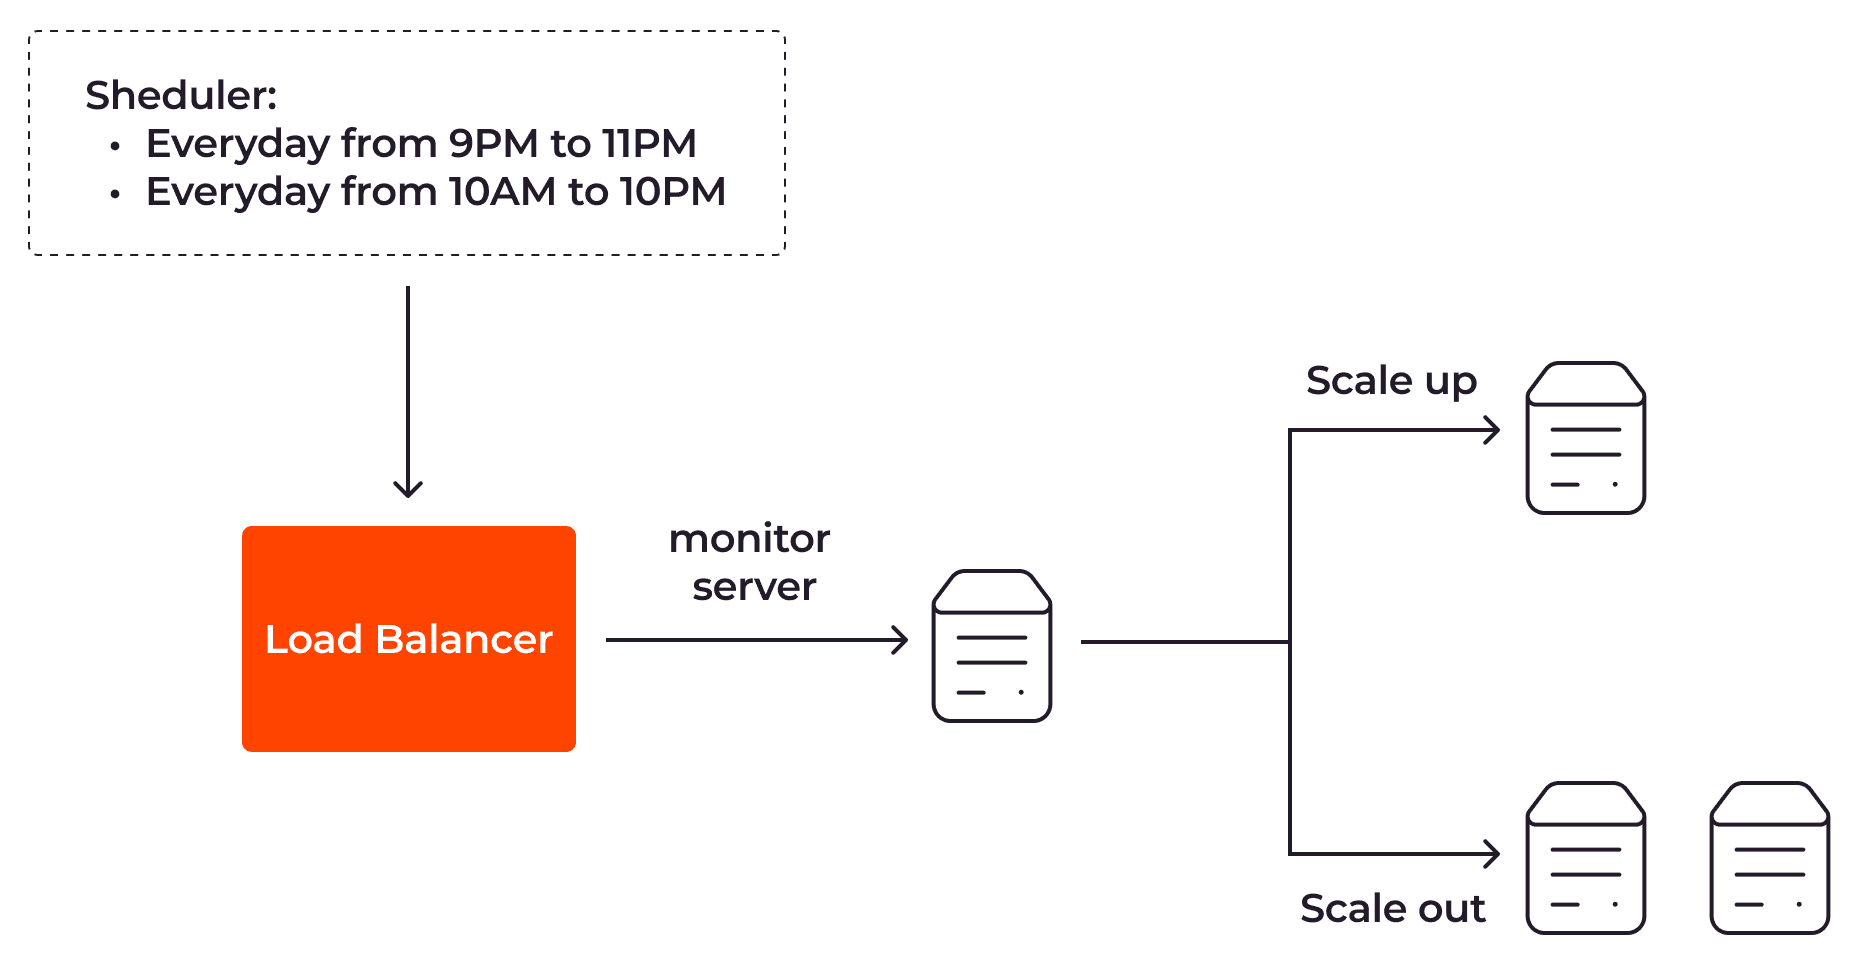
With scheduled autoscaling, your application servers are scaled according to a schedule that you set in advance.

How scheduled autoscaling works

Let’s say you have an online shopping web app that allows your customers to buy shoes and ties. Based on your application logs and metrics, you notice that they often visit the store on the weekend from 10 AM to 10 PM and on weekdays from 9 PM to 11 PM. With scheduled autoscaling, you can set your load balancer to use two servers at those times. At other times, one server instance should be enough.

Scheduled autoscaling is simple to set up and is well-suited for small applications with basic functionalities. However, it is ineffective for complex applications that are distributed globally with users worldwide. In this instance, you might want to use reactive autoscaling.

Reactive Autoscaling

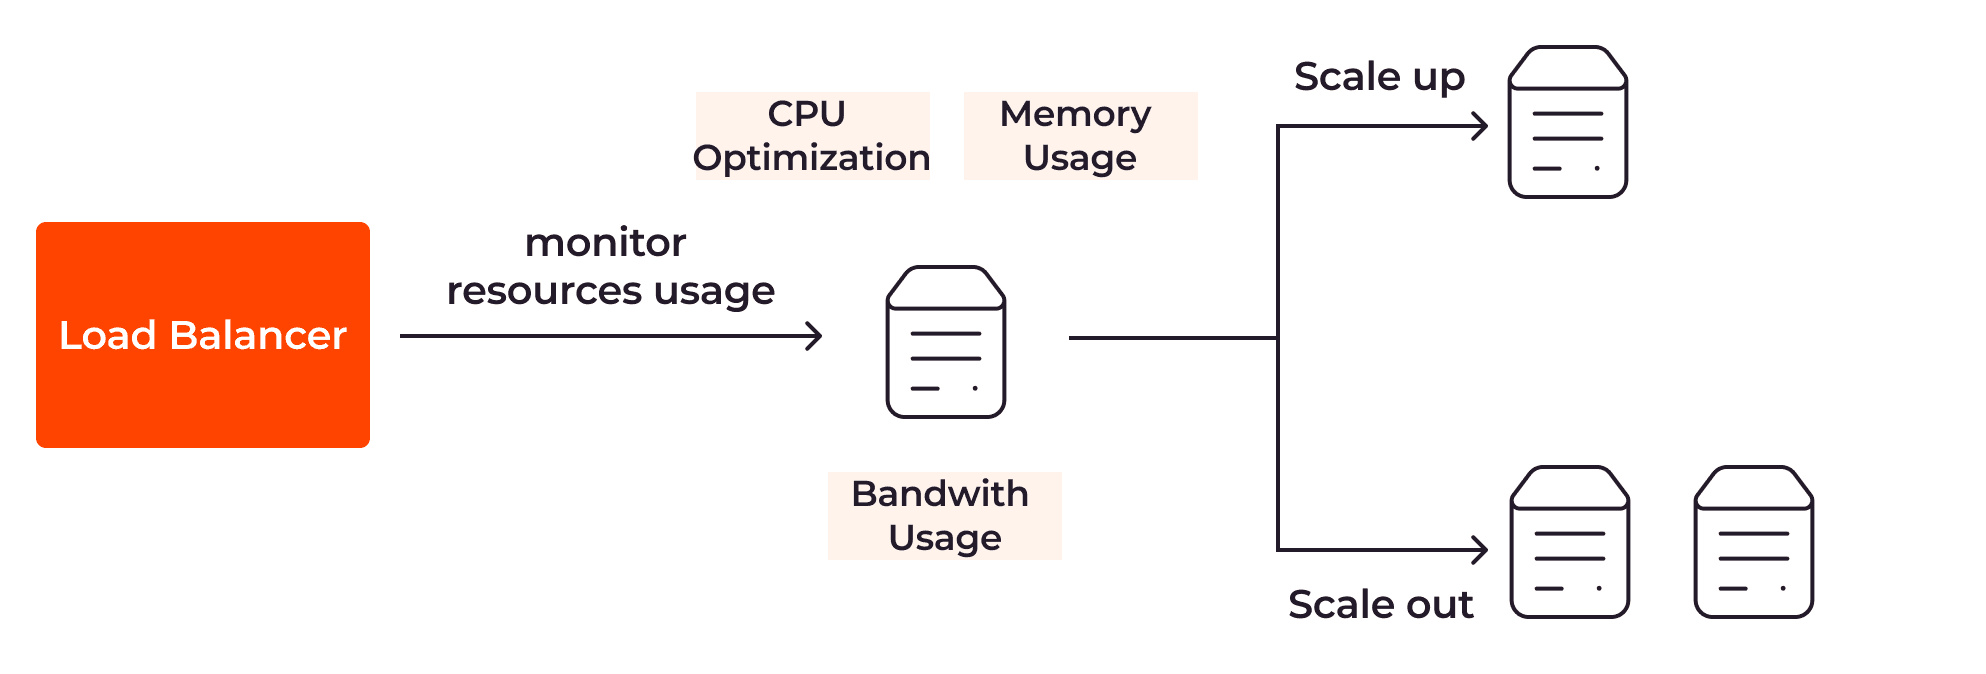
Reactive autoscaling scales the app servers based on metrics such as CPU optimization, memory usage, and disk space.

How reactive autoscaling works

To apply reactive autoscaling, you need to define the thresholds or conditions for your servers. For instance, if the average CPU optimization score exceeds 90%, the load balancer should add one more server instance. If the score is below 50%, the load balancer should remove one server instance from the server group.

Reactive autoscaling allows your application to scale flexibly in response to users’ interactions with your applications. However, one problem with reactive autoscaling is that the server resources might not be able to scale fast enough to handle the rapidly growing volume of user requests. As a result, users might experience poor performance—or even downtime.

Predictive Autoscaling

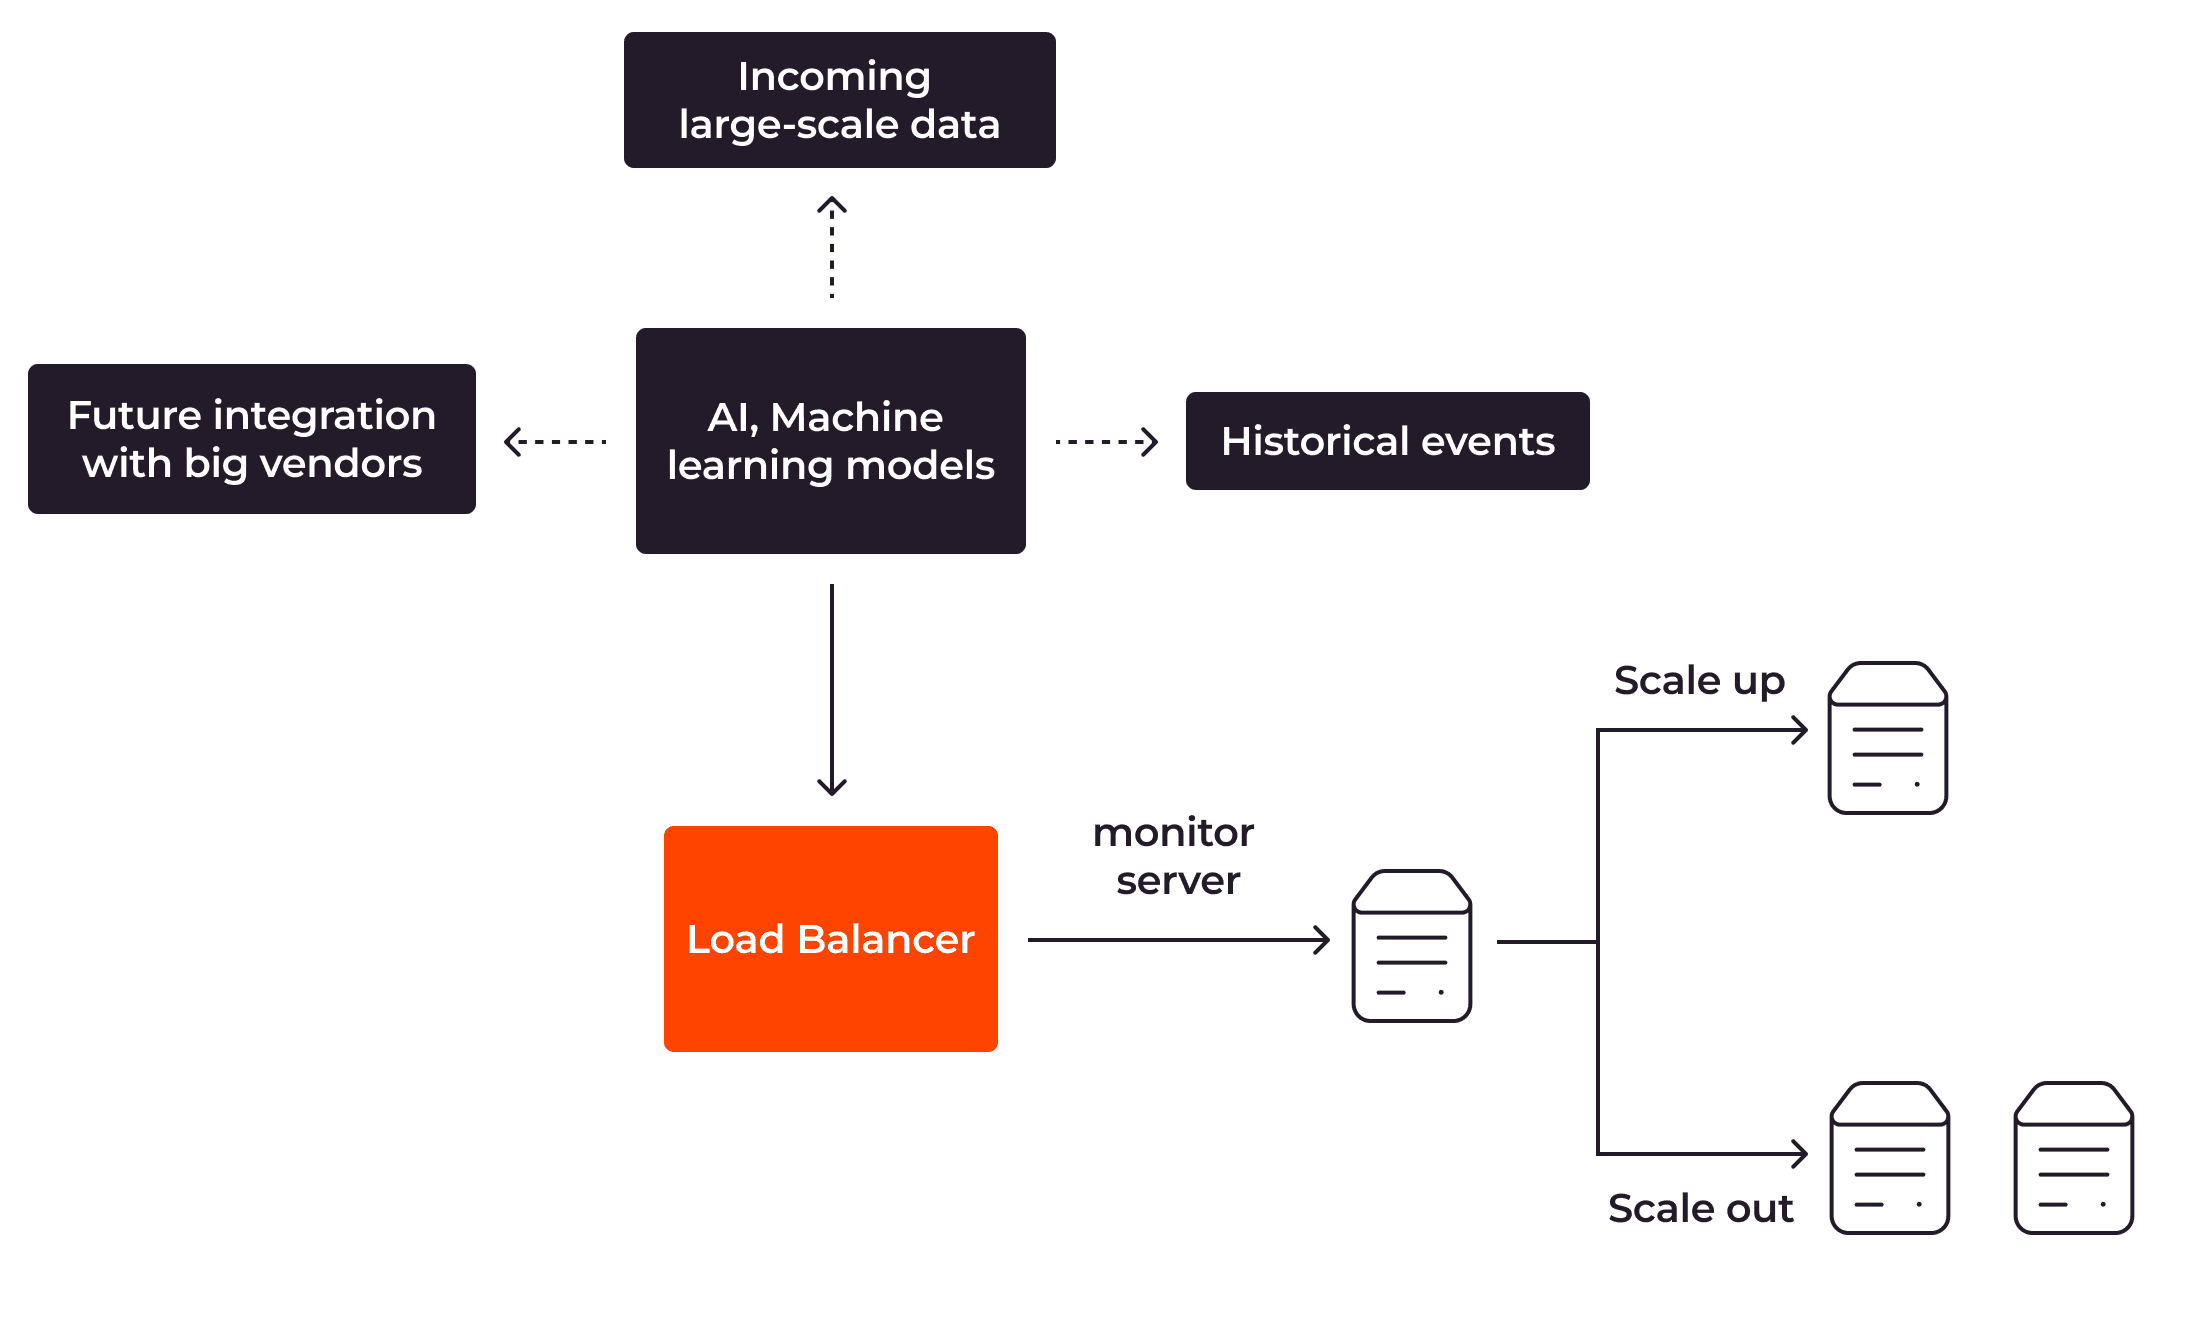
Predictive autoscaling is implemented using artificial intelligence or machine learning. It uses historical events and forecasting techniques to estimate the expected workload and system resource requirements.

How predictive autoscaling works

Predictive autoscaling allows your application to be scaled right before it becomes necessary. If it is implemented effectively, it can scale your app efficiently without causing performance problems or downtime. However, applying predictive autoscaling is a sophisticated task and hard to implement effectively because it depends heavily on the relevance of the historical data collected and the effectiveness of the forecasting models.

Zero Autoscaling

Most autoscaling methods require you to have at least one server node to begin with. Zero autoscaling allows you to start with no nodes if there is no requirement for server resources yet, and to scale out with nodes when the demand for the resources grows.

Zero autoscaling is helpful for application features that require heavy compute power and advanced technology, such as sequencing the whole genome in the human body. With such tasks, it is prohibitively expensive to keep the server running all the time when there’s no demand for it. Zero autoscaling allows you to optimize the cost of your infrastructure completely.

If you’re interested in using zero autoscaling for your application, check out Gcore Function as a Service (FaaS.) With Gcore FaaS, you can run and update your code in a cloud-made environment with ultimate flexibility. FaaS automatically scales to match the workload as your application gains more users. You get optimized infrastructure costs with the zero autoscaling capability that Gcore FaaS offers.

How to Enable Autoscaling for Applications

Many components play a role in an application running efficiently, including network systems, load balancers, databases, backend services, or frontend services. Autoscaling an application requires all these components to scale. Of them, databases and services are the most important because they are responsible for heavy computational tasks, such as executing complicated queries or running complex machine-learning models.

Autoscaling for Databases

For databases to work effectively, their performance and data storage capabilities must be autoscalable.

Autoscaling for Performance

Performance autoscaling allows you to apply vertical scaling to the databases directly by setting the mechanism to automatically add new server resources—like CPUs or RAM—to the current database node.

For distributed systems, you should autoscale the databases by applying horizontal scaling techniques, such as read replicas or database clustering. Using read replicas, the replicated database nodes are synchronized with the primary node, which helps in offloading read requests or analytics traffic from the primary node, while database clustering adds more servers to the cluster to work as a single powerful database.

Autoscaling for Data Storage

Data storage autoscaling ensures that data storage will be increased automatically when there is no longer enough space to store new data. For instance, if you have a large Hadoop cluster for storing structured and unstructured data, you can set the autoscaling mechanism to add more storage nodes to the existing cluster when the current storage is about to reach its limit.

Autoscaling for Services

To apply autoscaling to backend or frontend services, it’s vital to have access to application and server metrics such as response time, bandwidth usage, or memory usage. Based on these metrics, you can trigger the autoscaling feature by adding more server resources directly to the existing server or horizontal scaling by creating more service instances for more user requests.

Benefits of Autoscaling

Applying autoscaling to your application is a sophisticated task that demands monitoring, triggering, and load-balancing processes for various databases and services. However, the results you receive will justify the effort.

Cost Optimization

With the ability to scale in or down when fewer requests are sent to the server, you can control server costs by reducing wasted expenses. This is crucial, both for startup companies with limited budgets and for global companies with millions of users.

Reduced Downtime

Autoscaling allows new server instances to be added immediately when performance issues are seen on the existing servers. As a result, end users won’t experience the application downtime caused when you must scale the server manually.

Performance Optimization

Autoscaling improves the performance of your application by adding server resources before issues arise.

Lower Energy Consumption

By scaling in or scaling down server resources when they are not needed, autoscaling lowers electricity usage and network bandwidth. It also extends the lifespan of the server facilities. As a result, it’s fair to say that autoscaling even contributes to sustainability efforts in the tech world.

Automation

Autoscaling allows your application to be scaled automatically without human intervention. This removes the need to constantly monitor application metrics and system resources, which is time consuming and mentally exhausting, freeing up your time to work on other tasks, such as setting up the infrastructure for a new project.

Autoscaling Best Practices

To leverage the advantages of autoscaling, you should apply these five best practices:

#1 Ensure that the minimum nodes and maximum nodes values for the autoscaling configuration are different. When configuring the autoscaling mechanism, you usually need to indicate the minimum and maximum number of nodes for your servers. By defining the minimum number of nodes, you ensure that your application will always have enough system resources to run, even if only a few requests are sent to the server. With a limit on the maximum number of nodes, you ensure that if application errors or security incidents such as DDoS attacks happen, the system will not add too many servers. If the minimum nodes and maximum nodes have the same value, your autoscaling setup will not work because the number of nodes is always the same regardless of the workload on the servers.

#2 Choose appropriate performance metrics depending on your application requirements. You must apply the metrics that suit your app for autoscaling to work efficiently. This is especially important for reactive autoscaling based on application and server data, such as CPU optimization, response time, or memory usage. For example, real-time video game applications should use concurrent players’ metrics and other common metrics, such as CPU optimization or memory usage, to apply the autoscaling mechanism efficiently.

#3 Set a conservative threshold for your metrics with buffering in mind. The application of autoscaling is usually accompanied by a delay, so it’s always better to set thresholds for your metrics with buffering in mind. For example, for applications with a high traffic workload, set the maximum CPU optimization to 80% so that if there’s a delay in autoscaling your servers, the existing servers can still withstand the workload.

#4 Set autoscaling notifications. Set autoscaling notifications to alert you when problems arise. For example, you should be notified if the autoscaling mechanism is rapidly adding new servers to handle a growing number of requests. With that information in hand, you can identify a potential DDOS attack quickly and take steps to address it.

#5 Opt for reactive or predictive autoscaling over scheduled autoscaling. While scheduled autoscaling is simple to implement, it can easily go wrong if unexpected events occur, leading to performance issues or downtime. For example, a local online shopping site might experience an unpredicted spike of soccer shirt sales before an upcoming championship match.

Autoscaling FAQs

1. What are the differences between autoscaling and load balancing?

Although these two processes have functions that overlap, they differ from one another. Autoscaling is the process of applying automatic scaling to your application. Load balancing is one of the steps in that process: the distribution of the workload according to rules across server instances.

2. What are the differences between autoscaling and high availability?

Autoscaling allows you to scale your app automatically. As a result, users won’t experience application downtime, because your app can scale quickly and efficiently. High availability ensures that your application is live and accessible so that users do not encounter downtime issues. Autoscaling is one of the factors that contributes to high availability.

3. Can I apply infinite autoscaling to my app?

With horizontal scaling you can autoscale your app almost infinitely since you can have thousands—or even millions—of server instances. With vertical scaling, you are bound by the limited resources a single server can provide.

4. Is there a way to apply autoscaling to a centralized system?

Yes, you can apply autoscaling to a centralized system using a vertical scaling approach. However, unlike a distributed system, a centralized system encounters scalability-limitation issues.

Conclusion

Autoscaling allows your application to handle the application workload in a flexible, reactive, and predictive manner, without human intervention. It also helps you to optimize the cost of your infrastructure, a critical need for your company’s operational efficiency.

If you’re using Kubernetes to orchestrate your application containers, check out Gcore Managed Kubernetes. With Gcore Managed Kubernetes, you can quickly apply autoscaling for your Kubernetes in a matter of minutes, so that you can spend your time developing and deploying new features, instead of manually configuring the Kubernetes cluster from scratch. If you want to quickly implement a new feature to extend the functionality of your application, such as creating a notification service to send messages to Slack when a new user signs up, check out Gcore Function as a Service. Gcore FaaS allows you to run and update code in a ready-made environment so that you can deploy your new feature to solve your business needs right away.

Interested in Gcore Managed Kubernetes and Gcore FaaS? Get started for free.

Related articles

Pre-configure your dev environment with Gcore VM init scripts

Provisioning new cloud instances can be repetitive and time-consuming if you’re doing everything manually: installing packages, configuring environments, copying SSH keys, and more. With cloud-init, you can automate these tasks and launch development-ready instances from the start.Gcore Edge Cloud VMs support cloud-init out of the box. With a simple YAML script, you can automatically set up a development-ready instance at boot, whether you’re launching a single machine or spinning up a fleet.In this guide, we’ll walk through how to use cloud-init on Gcore Edge Cloud to:Set a passwordInstall packages and system updatesAdd users and SSH keysMount disks and write filesRegister services or install tooling like Docker or Node.jsLet’s get started.What is cloud-init?cloud-init is a widely used tool for customizing cloud instances during the first boot. It reads user-provided configuration data—usually YAML—and uses it to run commands, install packages, and configure the system. In this article, we will focus on Linux-based virtual machines.How to use cloud-init on GcoreFor Gcore Cloud VMs, cloud-init scripts are added during instance creation using the User data field in the UI or API.Step 1: Create a basic scriptStart with a simple YAML script. Here’s one that updates packages and installs htop:#cloud-config package_update: true packages: - htop Step 2: Launch a new VM with your scriptGo to the Gcore Customer Portal, navigate to VMs, and start creating a new instance (or just click here). When you reach the Additional options section, enable the User data option. Then, paste in your YAML cloud-init script.Once the VM boots, it will automatically run the script. This works the same way for all supported Linux distributions available through Gcore.3 real-world examplesLet’s look at three examples of how you can use this.Example 1: Add a password for a specific userThe below script sets the for the default user of the selected operating system:#cloud-config password: <password> chpasswd: {expire: False} ssh_pwauth: True Example 2: Dev environment with Docker and GitThe following script does the following:Installs Docker and GitAdds a new user devuser with sudo privilegesAuthorizes an SSH keyStarts Docker at boot#cloud-config package_update: true packages: - docker.io - git users: - default - name: devuser sudo: ALL=(ALL) NOPASSWD:ALL groups: docker shell: /bin/bash ssh-authorized-keys: - ssh-rsa AAAAB3Nza...your-key-here runcmd: - systemctl enable docker - systemctl start docker Example 3: Install Node.js and clone a repoThis script installs Node.js and clones a GitHub repo to your Gcore VM at launch:#cloud-config packages: - curl runcmd: - curl -fsSL https://deb.nodesource.com/setup_18.x | bash - - apt-get install -y nodejs - git clone https://github.com/example-user/dev-project.git /home/devuser/project Reusing and versioning your scriptsTo avoid reinventing the wheel, keep your cloud-init scripts:In version control (e.g., Git)Templated for different environments (e.g., dev vs staging)Modular so you can reuse base blocks across projectsYou can also use tools like Ansible or Terraform with cloud-init blocks to standardize provisioning across your team or multiple Gcore VM environments.Debugging cloud-initIf your script doesn’t behave as expected, SSH into the instance and check the cloud-init logs:sudo cat /var/log/cloud-init-output.log This file shows each command as it ran and any errors that occurred.Other helpful logs:/var/log/cloud-init.log /var/lib/cloud/instance/user-data.txt Pro tip: Echo commands or write log files in your script to help debug tricky setups—especially useful if you’re automating multi-node workflows across Gcore Cloud.Tips and best practicesIndentation matters! YAML is picky. Use spaces, not tabs.Always start the file with #cloud-config.runcmd is for commands that run at the end of boot.Use write_files to write configs, env variables, or secrets.Cloud-init scripts only run on the first boot. To re-run, you’ll need to manually trigger cloud-init or re-create the VM.Automate it all with GcoreIf you're provisioning manually, you're doing it wrong. Cloud-init lets you treat your VM setup as code: portable, repeatable, and testable. Whether you’re spinning up ephemeral dev boxes or preparing staging environments, Gcore’s support for cloud-init means you can automate it all.For more on managing virtual machines with Gcore, check out our product documentation.Explore Gcore VM product docs

How to cut egress costs and speed up delivery using Gcore CDN and Object Storage

If you’re serving static assets (images, videos, scripts, downloads) from object storage, you’re probably paying more than you need to, and your users may be waiting longer than they should.In this guide, we explain how to front your bucket with Gcore CDN to cache static assets, cut egress bandwidth costs, and get faster TTFB globally. We’ll walk through setup (public or private buckets), signed URL support, cache control best practices, debugging tips, and automation with the Gcore API or Terraform.Why bother?Serving directly from object storage hits your origin for every request and racks up egress charges. With a CDN in front, cached files are served from edge—faster for users, and cheaper for you.Lower TTFB, better UXWhen content is cached at the edge, it doesn’t have to travel across the planet to get to your user. Gcore CDN caches your assets at PoPs close to end users, so requests don’t hit origin unless necessary. Once cached, assets are delivered in a few milliseconds.Lower billsMost object storage providers charge $80–$120 per TB in egress fees. By fronting your storage with a CDN, you only pay egress once per edge location—then it’s all cache hits after that. If you’re using Gcore Storage and Gcore CDN, there’s zero egress fee between the two.Caching isn’t the only way you save. Gcore CDN can also compress eligible file types (like HTML, CSS, JavaScript, and JSON) on the fly, further shrinking bandwidth usage and speeding up file delivery—all without any changes to your storage setup.Less origin traffic and less data to transfer means smaller bills. And your storage bucket doesn’t get slammed under load during traffic spikes.Simple scaling, globallyThe CDN takes the hit, not your bucket. That means fewer rate-limit issues, smoother traffic spikes, and more reliable performance globally. Gcore CDN spans the globe, so you’re good whether your users are in Tokyo, Toronto, or Tel Aviv.Setup guide: Gcore CDN + Gcore Object StorageLet’s walk through configuring Gcore CDN to cache content from a storage bucket. This works with Gcore Object Storage and other S3-compatible services.Step 1: Prep your bucketPublic? Check files are publicly readable (via ACL or bucket policy).Private? Use Gcore’s AWS Signature V4 support—have your access key, secret, region, and bucket name ready.Gcore Object Storage URL format: https://<bucket-name>.<region>.cloud.gcore.lu/<object> Step 2: Create CDN resource (UI or API)In the Gcore Customer Portal:Go to CDN > Create CDN ResourceChoose "Accelerate and protect static assets"Set a CNAME (e.g. cdn.yoursite.com) if you want to use your domainConfigure origin:Public bucket: Choose None for authPrivate bucket: Choose AWS Signature V4, and enter credentialsChoose HTTPS as the origin protocolGcore will assign a *.gcdn.co domain. If you’re using a custom domain, add a CNAME: cdn.yoursite.com CNAME .gcdn.co Here’s how it works via Terraform: resource "gcore_cdn_resource" "cdn" { cname = "cdn.yoursite.com" origin_group_id = gcore_cdn_origingroup.origin.id origin_protocol = "HTTPS" } resource "gcore_cdn_origingroup" "origin" { name = "my-origin-group" origin { source = "mybucket.eu-west.cloud.gcore.lu" enabled = true } } Step 3: Set caching behaviorSet Cache-Control headers in your object metadata: Cache-Control: public, max-age=2592000 Too messy to handle in storage? Override cache logic in Gcore:Force TTLs by path or extensionIgnore or forward query strings in cache keyStrip cookies (if unnecessary for cache decisions)Pro tip: Use versioned file paths (/img/logo.v3.png) to bust cache safely.Secure access with signed URLsWant your assets to be private, but still edge-cacheable? Use Gcore’s Secure Token feature:Enable Secure Token in CDN settingsSet a secret keyGenerate time-limited tokens in your appPython example: import base64, hashlib, time secret = 'your_secret' path = '/videos/demo.mp4' expires = int(time.time()) + 3600 string = f"{expires}{path} {secret}" token = base64.urlsafe_b64encode(hashlib.md5(string.encode()).digest()).decode().strip('=') url = f"https://cdn.yoursite.com{path}?md5={token}&expires={expires}" Signed URLs are verified at the CDN edge. Invalid or expired? Blocked before origin is touched.Optional: Bind the token to an IP to prevent link sharing.Debug and cache tuneUse curl or browser devtools: curl -I https://cdn.yoursite.com/img/logo.png Look for:Cache: HIT or MISSCache-ControlX-Cached-SinceCache not working? Check for the following errors:Origin doesn’t return Cache-ControlCDN override TTL not appliedCache key includes query strings unintentionallyYou can trigger purges from the Gcore Customer Portal or automate them via the API using POST /cdn/purge. Choose one of three ways:Purge all: Clear the entire domain’s cache at once.Purge by URL: Target a specific full path (e.g., /images/logo.png).Purge by pattern: Target a set of files using a wildcard at the end of the pattern (e.g., /videos/*).Monitor and optimize at scaleAfter rollout:Watch origin bandwidth dropCheck hit ratio (aim for >90%)Audit latency (TTFB on HIT vs MISS)Consider logging using Gcore’s CDN logs uploader to analyze cache behavior, top requested paths, or cache churn rates.For maximum savings, combine Gcore Object Storage with Gcore CDN: egress traffic between them is 100% free. That means you can serve cached assets globally without paying a cent in bandwidth fees.Using external storage? You’ll still slash egress costs by caching at the edge and cutting direct origin traffic—but you’ll unlock the biggest savings when you stay inside the Gcore ecosystem.Save money and boost performance with GcoreStill serving assets direct from storage? You’re probably wasting money and compromising performance on the table. Front your bucket with Gcore CDN. Set smart cache headers or use overrides. Enable signed URLs if you need control. Monitor cache HITs and purge when needed. Automate the setup with Terraform. Done.Next steps:Create your CDN resourceUse private object storage with Signature V4Secure your CDN with signed URLsCreate a free CDN resource now

Bare metal vs. virtual machines: performance, cost, and use case comparison

Choosing the right type of server infrastructure is critical to how your application performs, scales, and fits your budget. For most workloads, the decision comes down to two core options: bare metal servers and virtual machines (VMs). Both can be deployed in the cloud, but they differ significantly in terms of performance, control, scalability, and cost.In this article, we break down the core differences between bare metal and virtual servers, highlight when to choose each, and explain how Gcore can help you deploy the right infrastructure for your needs. If you want to learn about either BM or VMs in detail, we’ve got articles for those: here’s the one for bare metal, and here’s a deep dive into virtual machines.Bare metal vs. virtual machines at a glanceWhen evaluating whether bare metal or virtual machines are right for your company, consider your specific workload requirements, performance priorities, and business objectives. Here’s a quick breakdown to help you decide what works best for you.FactorBare metal serversVirtual machinesPerformanceDedicated resources; ideal for high-performance workloadsShared resources; suitable for moderate or variable workloadsScalabilityOften requires manual scaling; less flexibleHighly elastic; easy to scale up or downCustomizationFull control over hardware, OS, and configurationLimited by hypervisor and provider’s environmentSecurityIsolated by default; no hypervisor layerShared environment with strong isolation protocolsCostHigher upfront cost; dedicated hardwarePay-as-you-go pricing; cost-effective for flexible workloadsBest forHPC, AI/ML, compliance-heavy workloadsStartups, dev/test, fast-scaling applicationsAll about bare metal serversA bare metal server is a single-tenant physical server rented from a cloud provider. Unlike virtual servers, the hardware is not shared with other users, giving you full access to all resources and deeper control over configurations. You get exclusive access and control over the hardware via the cloud provider, which offers the stability and security needed for high-demand applications.The benefits of bare metal serversHere are some of the business advantages of opting for a bare metal server:Maximized performance: Because they are dedicated resources, bare metal servers provide top-tier performance without sharing processing power, memory, or storage with other users. This makes them ideal for resource-intensive applications like high-performance computing (HPC), big data processing, and game hosting.Greater control: Since you have direct access to the hardware, you can customize the server to meet your specific requirements. This is especially important for businesses with complex, specialized needs that require fine-tuned configurations.High security: Bare metal servers offer a higher level of security than their alternatives due to the absence of virtualization. With no shared resources or hypervisor layer, there’s less risk of vulnerabilities that come with multi-tenant environments.Dedicated resources: Because you aren’t sharing the server with other users, all server resources are dedicated to your application so that you consistently get the performance you need.Who should use bare metal servers?Here are examples of instances where bare metal servers are the best option for a business:High-performance computing (HPC)Big data processing and analyticsResource-intensive applications, such as AI/ML workloadsGame and video streaming serversBusinesses requiring enhanced security and complianceAll about virtual machinesA virtual server (or virtual machine) runs on top of a physical server that’s been partitioned by a cloud provider using a hypervisor. This allows multiple VMs to share the same hardware while remaining isolated from each other.Unlike bare metal servers, virtual machines share the underlying hardware with other cloud provider customers. That means you’re using (and paying for) part of one server, providing cost efficiency and flexibility.The benefits of virtual machinesHere are some advantages of using a shared virtual machine:Scalability: Virtual machines are ideal for businesses that need to scale quickly and are starting at a small scale. With cloud-based virtualization, you can adjust your server resources (CPU, memory, storage) on demand to match changing workloads.Cost efficiency: You pay only for the resources you use with VMs, making them cost-effective for companies with fluctuating resource needs, as there is no need to pay for unused capacity.Faster deployment: VMs can be provisioned quickly and easily, which makes them ideal for anyone who wants to deploy new services or applications fast.Who should use virtual machines?VMs are a great fit for the following:Web hosting and application hostingDevelopment and testing environmentsRunning multiple apps with varying demandsStartups and growing businesses requiring scalabilityBusinesses seeking cost-effective, flexible solutionsWhich should you choose?There’s no one-size-fits-all answer. Your choice should depend on the needs of your workload:Choose bare metal if you need dedicated performance, low-latency access to hardware, or tighter control over security and compliance.Choose virtual servers if your priority is flexible scaling, faster deployment, and optimized cost.If your application uses GPU-based inference or AI training, check out our dedicated guide to VM vs. BM for AI workloads.Get started with Gcore BM or VMs todayAt Gcore, we provide both bare metal and virtual machine solutions, offering flexibility, performance, and reliability to meet your business needs. Gcore Bare Metal has the power and reliability needed for demanding workloads, while Gcore Virtual Machines offers customizable configurations, free egress traffic, and flexibility.Compare Gcore BM and VM pricing now

Optimize your workload: a guide to selecting the best virtual machine configuration

Virtual machines (VMs) offer the flexibility, scalability, and cost-efficiency that businesses need to optimize workloads. However, choosing the wrong setup can lead to poor performance, wasted resources, and unnecessary costs.In this guide, we’ll walk you through the essential factors to consider when selecting the best virtual machine configuration for your specific workload needs.﹟1 Understand your workload requirementsThe first step in choosing the right virtual machine configuration is understanding the nature of your workload. Workloads can range from light, everyday tasks to resource-intensive applications. When making your decision, consider the following:Compute-intensive workloads: Applications like video rendering, scientific simulations, and data analysis require a higher number of CPU cores. Opt for VMs with multiple processors or CPUs for smoother performance.Memory-intensive workloads: Databases, big data analytics, and high-performance computing (HPC) jobs often need more RAM. Choose a VM configuration that provides sufficient memory to avoid memory bottlenecks.Storage-intensive workloads: If your workload relies heavily on storage, such as file servers or applications requiring frequent read/write operations, prioritize VM configurations that offer high-speed storage options, such as SSDs or NVMe.I/O-intensive workloads: Applications that require frequent network or disk I/O, such as cloud services and distributed applications, benefit from VMs with high-bandwidth and low-latency network interfaces.﹟2 Consider VM size and scalabilityOnce you understand your workload’s requirements, the next step is to choose the right VM size. VM sizes are typically categorized by the amount of CPU, memory, and storage they offer.Start with a baseline: Select a VM configuration that offers a balanced ratio of CPU, RAM, and storage based on your workload type.Scalability: Choose a VM size that allows you to easily scale up or down as your needs change. Many cloud providers offer auto-scaling capabilities that adjust your VM’s resources based on real-time demand, providing flexibility and cost savings.Overprovisioning vs. underprovisioning: Avoid overprovisioning (allocating excessive resources) unless your workload demands peak capacity at all times, as this can lead to unnecessary costs. Similarly, underprovisioning can affect performance, so finding the right balance is essential.﹟3 Evaluate CPU and memory considerationsThe central processing unit (CPU) and memory (RAM) are the heart of a virtual machine. The configuration of both plays a significant role in performance. Workloads that need high processing power, such as video encoding, machine learning, or simulations, will benefit from VMs with multiple CPU cores. However, be mindful of CPU architecture—look for VMs that offer the latest processors (e.g., Intel Xeon, AMD EPYC) for better performance per core.It’s also important that the VM has enough memory to avoid paging, which occurs when the system uses disk space as virtual memory, significantly slowing down performance. Consider a configuration with more RAM and support for faster memory types like DDR4 for memory-heavy applications.﹟4 Assess storage performance and capacityStorage performance and capacity can significantly impact the performance of your virtual machine, especially for applications requiring large data volumes. Key considerations include:Disk type: For faster read/write operations, opt for solid-state drives (SSDs) over traditional hard disk drives (HDDs). Some cloud providers also offer NVMe storage, which can provide even greater speed for highly demanding workloads.Disk size: Choose the right size based on the amount of data you need to store and process. Over-allocating storage space might seem like a safe bet, but it can also increase costs unnecessarily. You can always resize disks later, so avoid over-allocating them upfront.IOPS and throughput: Some workloads require high input/output operations per second (IOPS). If this is a priority for your workload (e.g., databases), make sure that your VM configuration includes high IOPS storage options.﹟5 Weigh up your network requirementsWhen working with cloud-based VMs, network performance is a critical consideration. High-speed and low-latency networking can make a difference for applications such as online gaming, video conferencing, and real-time analytics.Bandwidth: Check whether the VM configuration offers the necessary bandwidth for your workload. For applications that handle large data transfers, such as cloud backup or file servers, make sure that the network interface provides high throughput.Network latency: Low latency is crucial for applications where real-time performance is key (e.g., trading systems, gaming). Choose VMs with low-latency networking options to minimize delays and improve the user experience.Network isolation and security: Check if your VM configuration provides the necessary network isolation and security features, especially when handling sensitive data or operating in multi-tenant environments.﹟6 Factor in cost considerationsWhile it’s essential that your VM has the right configuration, cost is always an important factor to consider. Cloud providers typically charge based on the resources allocated, so optimizing for cost efficiency can significantly impact your budget.Consider whether a pay-as-you-go or reserved model (which offers discounted rates in exchange for a long-term commitment) fits your usage pattern. The reserved option can provide significant savings if your workload runs continuously. You can also use monitoring tools to track your VM’s performance and resource usage over time. This data will help you make informed decisions about scaling up or down so you’re not paying for unused resources.﹟7 Evaluate security featuresSecurity is a primary concern when selecting a VM configuration, especially for workloads handling sensitive data. Consider the following:Built-in security: Look for VMs that offer integrated security features such as DDoS protection, web application firewall (WAF), and encryption.Compliance: Check that the VM configuration meets industry standards and regulations, such as GDPR, ISO 27001, and PCI DSS.Network security: Evaluate the VM's network isolation capabilities and the availability of cloud firewalls to manage incoming and outgoing traffic.﹟8 Consider geographic locationThe geographic location of your VM can impact latency and compliance. Therefore, it’s a good idea to choose VM locations that are geographically close to your end users to minimize latency and improve performance. In addition, it’s essential to select VM locations that comply with local data sovereignty laws and regulations.﹟9 Assess backup and recovery optionsBackup and recovery are critical for maintaining data integrity and availability. Look for VMs that offer automated backup solutions so that data is regularly saved. You should also evaluate disaster recovery capabilities, including the ability to quickly restore data and applications in case of failure.﹟10 Test and iterateFinally, once you've chosen a VM configuration, testing its performance under real-world conditions is essential. Most cloud providers offer performance monitoring tools that allow you to assess how well your VM is meeting your workload requirements.If you notice any performance bottlenecks, be prepared to adjust the configuration. This could involve increasing CPU cores, adding more memory, or upgrading storage. Regular testing and fine-tuning means that your VM is always optimized.Choosing a virtual machine that suits your requirementsSelecting the best virtual machine configuration is a key step toward optimizing your workloads efficiently, cost-effectively, and without unnecessary performance bottlenecks. By understanding your workload’s needs, considering factors like CPU, memory, storage, and network performance, and continuously monitoring resource usage, you can make informed decisions that lead to better outcomes and savings.Whether you're running a small application or large-scale enterprise software, the right VM configuration can significantly improve performance and cost. Gcore offers a wide range of virtual machine options that can meet your unique requirements. Our virtual machines are designed to meet diverse workload requirements, providing dedicated vCPUs, high-speed storage, and low-latency networking across 30+ global regions. You can scale compute resources on demand, benefit from free egress traffic, and enjoy flexible pricing models by paying only for the resources in use, maximizing the value of your cloud investments.Contact us to discuss your VM needs

How to get the size of a directory in Linux

Understanding how to check directory size in Linux is critical for managing storage space efficiently. Understanding this process is essential whether you’re assessing specific folder space or preventing storage issues.This comprehensive guide covers commands and tools so you can easily calculate and analyze directory sizes in a Linux environment. We will guide you step-by-step through three methods: du, ncdu, and ls -la. They’re all effective and each offers different benefits.What is a Linux directory?A Linux directory is a special type of file that functions as a container for storing files and subdirectories. It plays a key role in organizing the Linux file system by creating a hierarchical structure. This arrangement simplifies file management, making it easier to locate, access, and organize related files. Directories are fundamental components that help ensure smooth system operations by maintaining order and facilitating seamless file access in Linux environments.#1 Get Linux directory size using the du commandUsing the du command, you can easily determine a directory’s size by displaying the disk space used by files and directories. The output can be customized to be presented in human-readable formats like kilobytes (KB), megabytes (MB), or gigabytes (GB).Check the size of a specific directory in LinuxTo get the size of a specific directory, open your terminal and type the following command:du -sh /path/to/directoryIn this command, replace /path/to/directory with the actual path of the directory you want to assess. The -s flag stands for “summary” and will only display the total size of the specified directory. The -h flag makes the output human-readable, showing sizes in a more understandable format.Example: Here, we used the path /home/ubuntu/, where ubuntu is the name of our username directory. We used the du command to retrieve an output of 32K for this directory, indicating a size of 32 KB.Check the size of all directories in LinuxTo get the size of all files and directories within the current directory, use the following command:sudo du -h /path/to/directoryExample: In this instance, we again used the path /home/ubuntu/, with ubuntu representing our username directory. Using the command du -h, we obtained an output listing all files and directories within that particular path.#2 Get Linux directory size using ncduIf you’re looking for a more interactive and feature-rich approach to exploring directory sizes, consider using the ncdu (NCurses Disk Usage) tool. ncdu provides a visual representation of disk usage and allows you to navigate through directories, view size details, and identify large files with ease.For Debian or Ubuntu, use this command:sudo apt-get install ncduOnce installed, run ncdu followed by the path to the directory you want to analyze:ncdu /path/to/directoryThis will launch the ncdu interface, which shows a breakdown of file and subdirectory sizes. Use the arrow keys to navigate and explore various folders, and press q to exit the tool.Example: Here’s a sample output of using the ncdu command to analyze the home directory. Simply enter the ncdu command and press Enter. The displayed output will look something like this:#3 Get Linux directory size using 1s -1aYou can alternatively opt to use the ls command to list the files and directories within a directory. The options -l and -a modify the default behavior of ls as follows:-l (long listing format)Displays the detailed information for each file and directoryShows file permissions, the number of links, owner, group, file size, the timestamp of the last modification, and the file/directory name-a (all files)Instructs ls to include all files, including hidden files and directoriesIncludes hidden files on Linux that typically have names beginning with a . (dot)ls -la lists all files (including hidden ones) in long format, providing detailed information such as permissions, owner, group, size, and last modification time. This command is especially useful when you want to inspect file attributes or see hidden files and directories.Example: When you enter ls -la command and press Enter, you will see an output similar to this:Each line includes:File type and permissions (e.g., drwxr-xr-x):The first character indicates the file type- for a regular filed for a directoryl for a symbolic linkThe next nine characters are permissions in groups of three (rwx):r = readw = writex = executePermissions are shown for three classes of users: owner, group, and others.Number of links (e.g., 2):For regular files, this usually indicates the number of hard linksFor directories, it often reflects subdirectory links (e.g., the . and .. entries)Owner and group (e.g., user group)File size (e.g., 4096 or 1045 bytes)Modification date and time (e.g., Jan 7 09:34)File name (e.g., .bashrc, notes.txt, Documents):Files or directories that begin with a dot (.) are hidden (e.g., .bashrc)ConclusionThat’s it! You can now determine the size of a directory in Linux. Measuring directory sizes is a crucial skill for efficient storage management. Whether you choose the straightforward du command, use the visual advantages of the ncdu tool, or opt for the versatility of ls -la, this expertise enhances your ability to uphold an organized and efficient Linux environment.Looking to deploy Linux in the cloud? With Gcore Edge Cloud, you can choose from a wide range of pre-configured virtual machines suitable for Linux:Affordable shared compute resources starting from €3.2 per monthDeploy across 50+ cloud regions with dedicated servers for low-latency applicationsSecure apps and data with DDoS protection, WAF, and encryption at no additional costGet started today

How to Run Hugging Face Spaces on Gcore Inference at the Edge

Running machine learning models, especially large-scale models like GPT 3 or BERT, requires a lot of computing power and comes with a lot of latency. This makes real-time applications resource-intensive and challenging to deliver. Running ML models at the edge is a lightweight approach offering significant advantages for latency, privacy, and resource optimization.  Gcore Inference at the Edge makes it simple to deploy and manage custom models efficiently, giving you the ability to deploy and scale your favorite Hugging Face models globally in just a few clicks. In this guide, we’ll walk you through how easy it is to harness the power of Gcore’s edge AI infrastructure to deploy a Hugging Face Space model. Whether you’re developing NLP solutions or cutting-edge computer vision applications, deploying at the edge has never been simpler—or more powerful. Step 1: Log In to the Gcore Customer PortalGo to gcore.com and log in to the Gcore Customer Portal. If you don’t yet have an account, go ahead and create one—it’s free. Step 2: Go to Inference at the EdgeIn the Gcore Customer Portal, click Inference at the Edge from the left navigation menu. Then click Deploy custom model. Step 3: Choose a Hugging Face ModelOpen huggingface.com and browse the available models. Select the model you want to deploy. Navigate to the corresponding Hugging Face Space for the model. Click on Files in the Space and locate the Docker option. Copy the Docker image link and startup command from Hugging Face Space. Step 4: Deploy the Model on GcoreReturn to the Gcore Customer Portal deployment page and enter the following details: Model image URL: registry.hf.space/ethux-mistral-pixtral-demo:latest Startup command: python app.py Container port: 7860 Configure the pod as follows: GPU-optimized: 1x L40S vCPUs: 16 RAM: 232GiB For optimal performance, choose any available region for routing placement. Name your deployment and click Deploy.Step 5: Interact with Your ModelOnce the model is up and running, you’ll be provided with an endpoint. You can now interact with the model via this endpoint to test and use your deployed model at the edge.Powerful, Simple AI Deployment with GcoreGcore Inference at the Edge is the future of AI deployment, combining the ease of Hugging Face integration with the robust infrastructure needed for real-time, scalable, and global solutions. By leveraging edge computing, you can optimize model performance and simultaneously futureproof your business in a world that increasingly demands fast, secure, and localized AI applications. Deploying models to the edge allows you to capitalize on real-time insights, improve customer experiences, and outpace your competitors. Whether you’re leading a team of developers or spearheading a new AI initiative, Gcore Inference at the Edge offers the tools you need to innovate at the speed of tomorrow. Explore Gcore Inference at the Edge

Subscribe to our newsletter

Get the latest industry trends, exclusive insights, and Gcore updates delivered straight to your inbox.