Run Grafana on an Ubuntu server Using Gcore Cloud
- May 3, 2023
- 2 min read

In this article, we will discuss how to set up Grafana on an Ubuntu server using Gcore Cloud. We will use a preconfigured Grafana server instance from our Marketplace. The main advantage of this approach is that it saves you time and effort: you get a ready-to-use Grafana server in ten to fifteen minutes. You simply need to create an instance and connect to Grafana through your web browser, then you’ll be able to create dashboards. No manual manipulations are required in the command line.
What Is Grafana?
Grafana is an open-source platform for data visualization and monitoring. It allows you to create customizable and interactive dashboards, alerts, and panels. For example, you can take data from different cloud services and visualize it all in a single Grafana dashboard.
How to Run Grafana
Step 1. Create a Virtual Machine with a Grafana Server
First, let’s create a virtual machine with a Grafana server.
- Log in to your Gcore Cloud account. If you don’t have an account yet, sign up.
- Go to Cloud and select Projects.
- Click Create project; fill in the Name field. Projects are groups of separate Cloud resources, and these groups are isolated from each other. The isolation gives you the ability to set user rights for each project.
- In your project, click Create Instance:
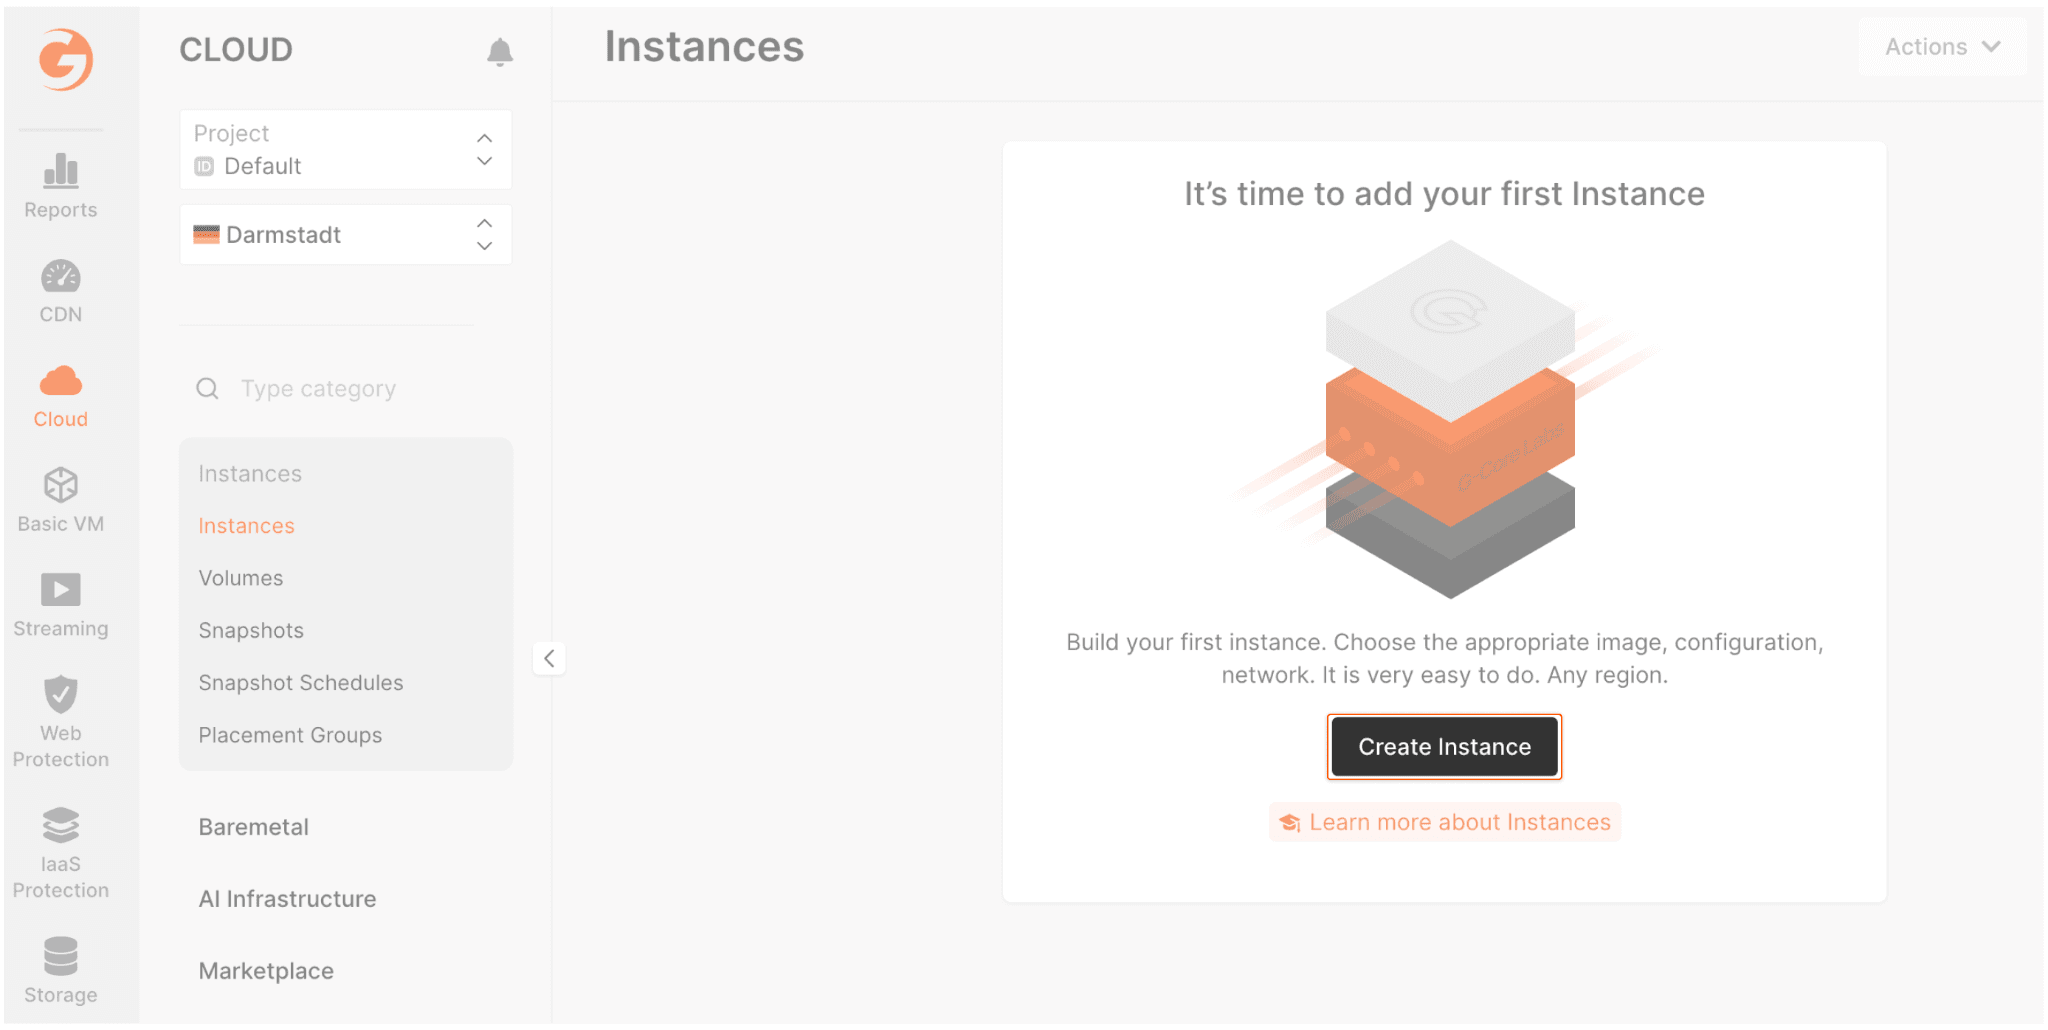
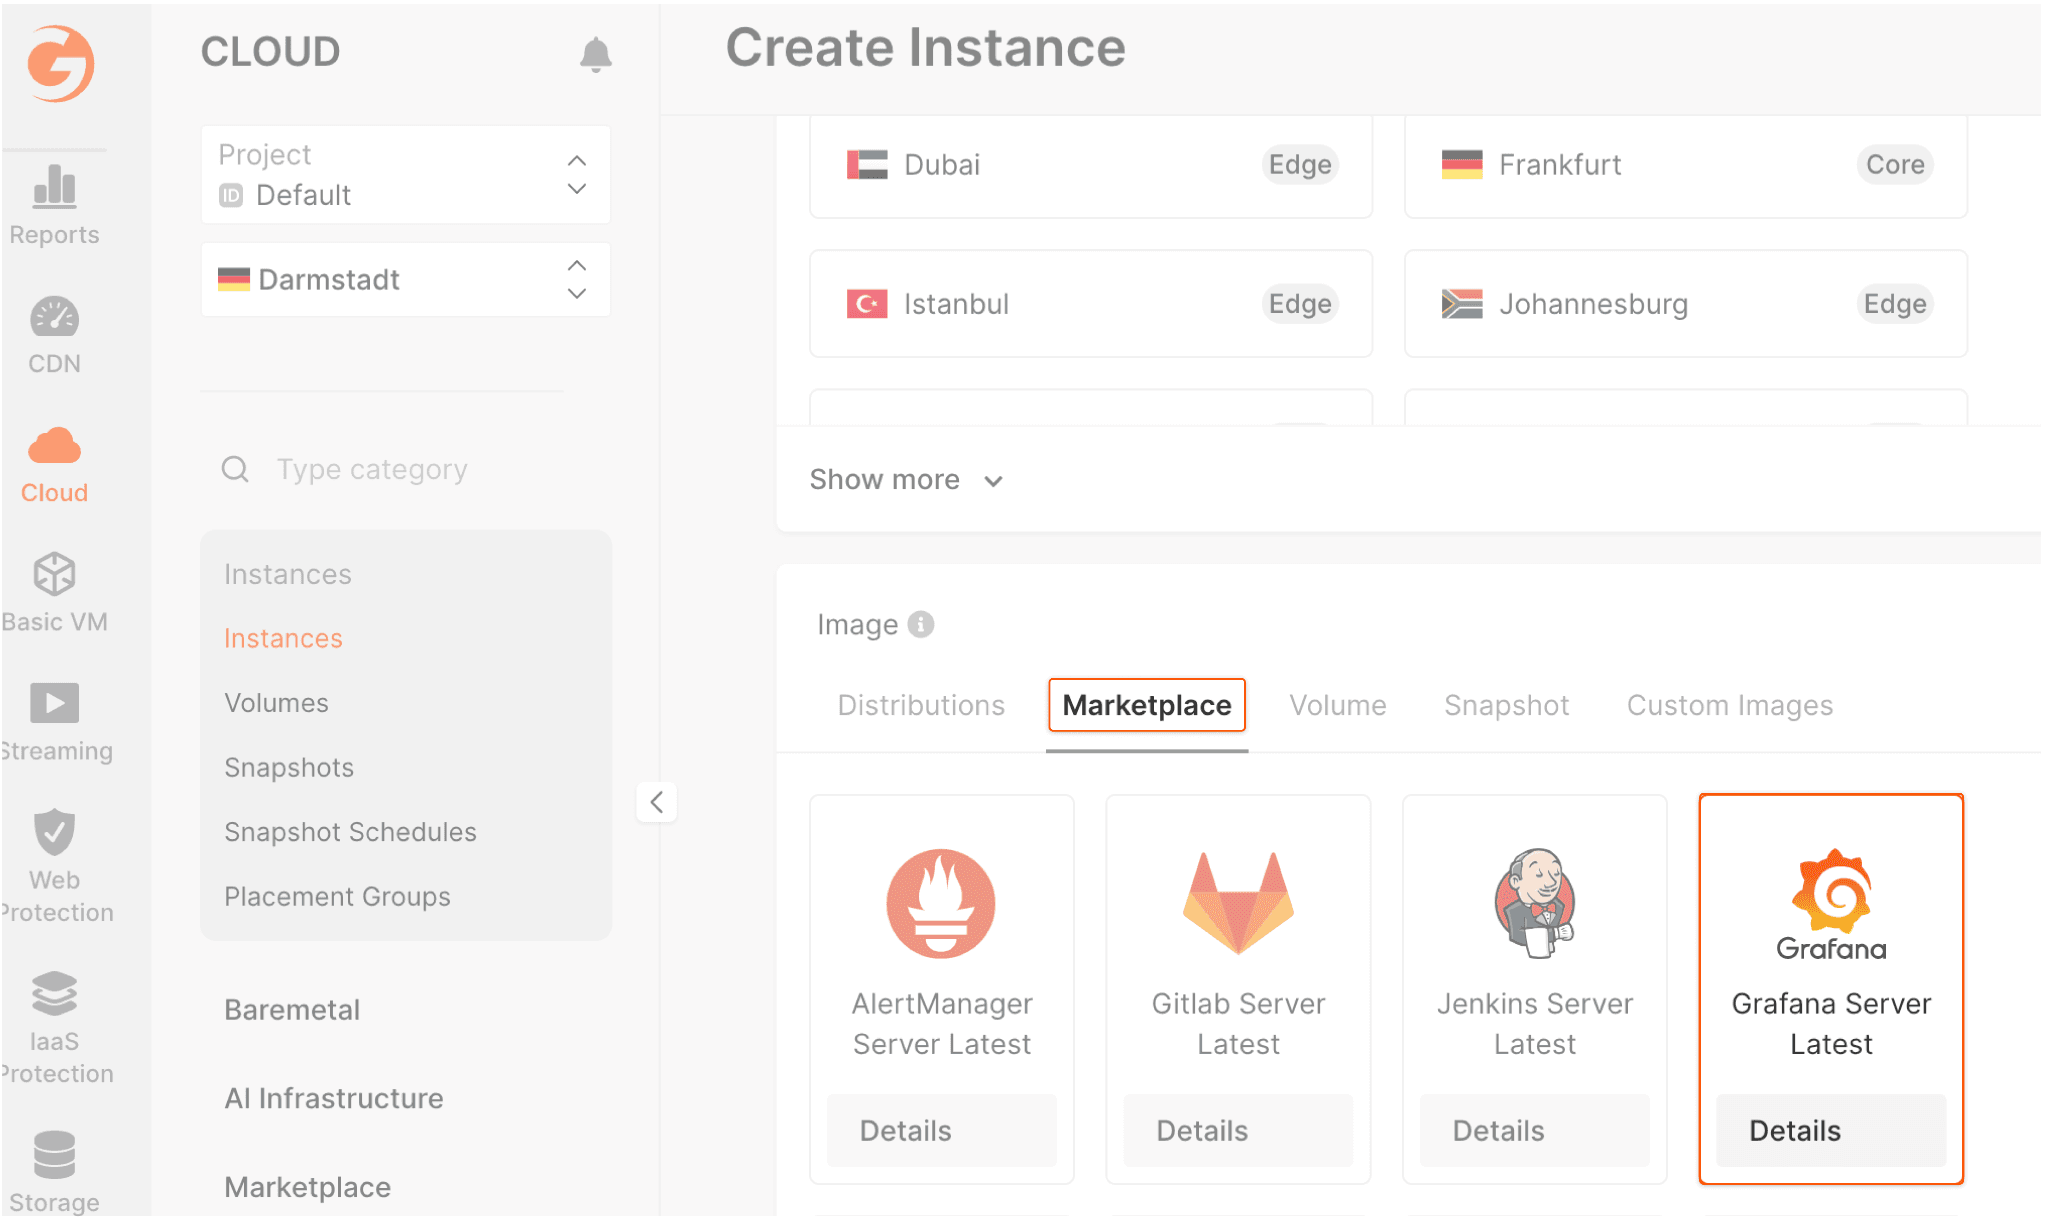
- Select one of the available regions.
- In the Image section select Marketplace and click the “Grafana Server Latest” image.
- Set the following parameters:
- App Template Configuration: external URL if you have a domain.
- Type: choose 1vCPU / 2GB RAM with the “Basic VM” configuration or any available.
- Volume: set any volume type with 10GB.
- Network: set by default to a public IP.
- Firewall: select “Default” with the “Add application ports to firewall group” flag.
- SSH Key: choose your public SSH key or generate a new one.
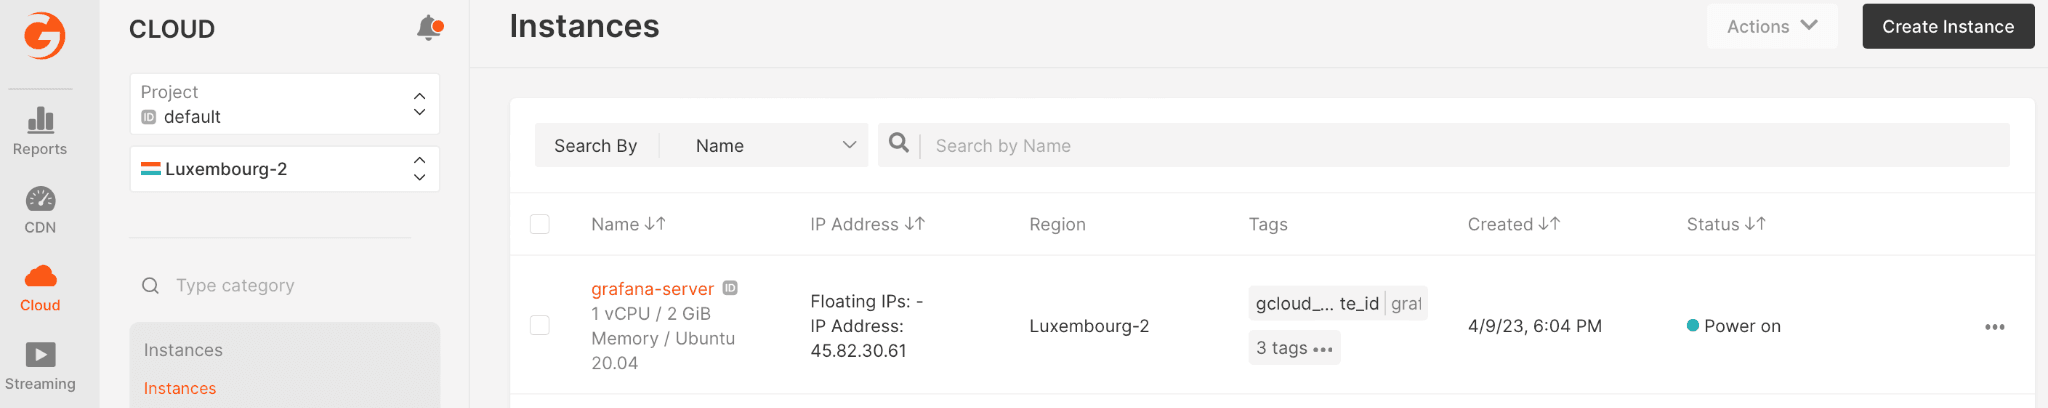
- Instance name: grafana-server (or whatever you want.)
- After setting up is done, click Create Instance. The virtual machine will appear in the “Instances” list. Wait until the virtual machine’s “Creating” status changes to “Power on.”
Step 2. Open the Grafana Server
By default, Grafana runs on port 3000. To access the Grafana dashboard, open a web browser and enter the URL of your Grafana server:
http://<your_public_ip_address>:3000
For example:
http://45.82.30.61:3000
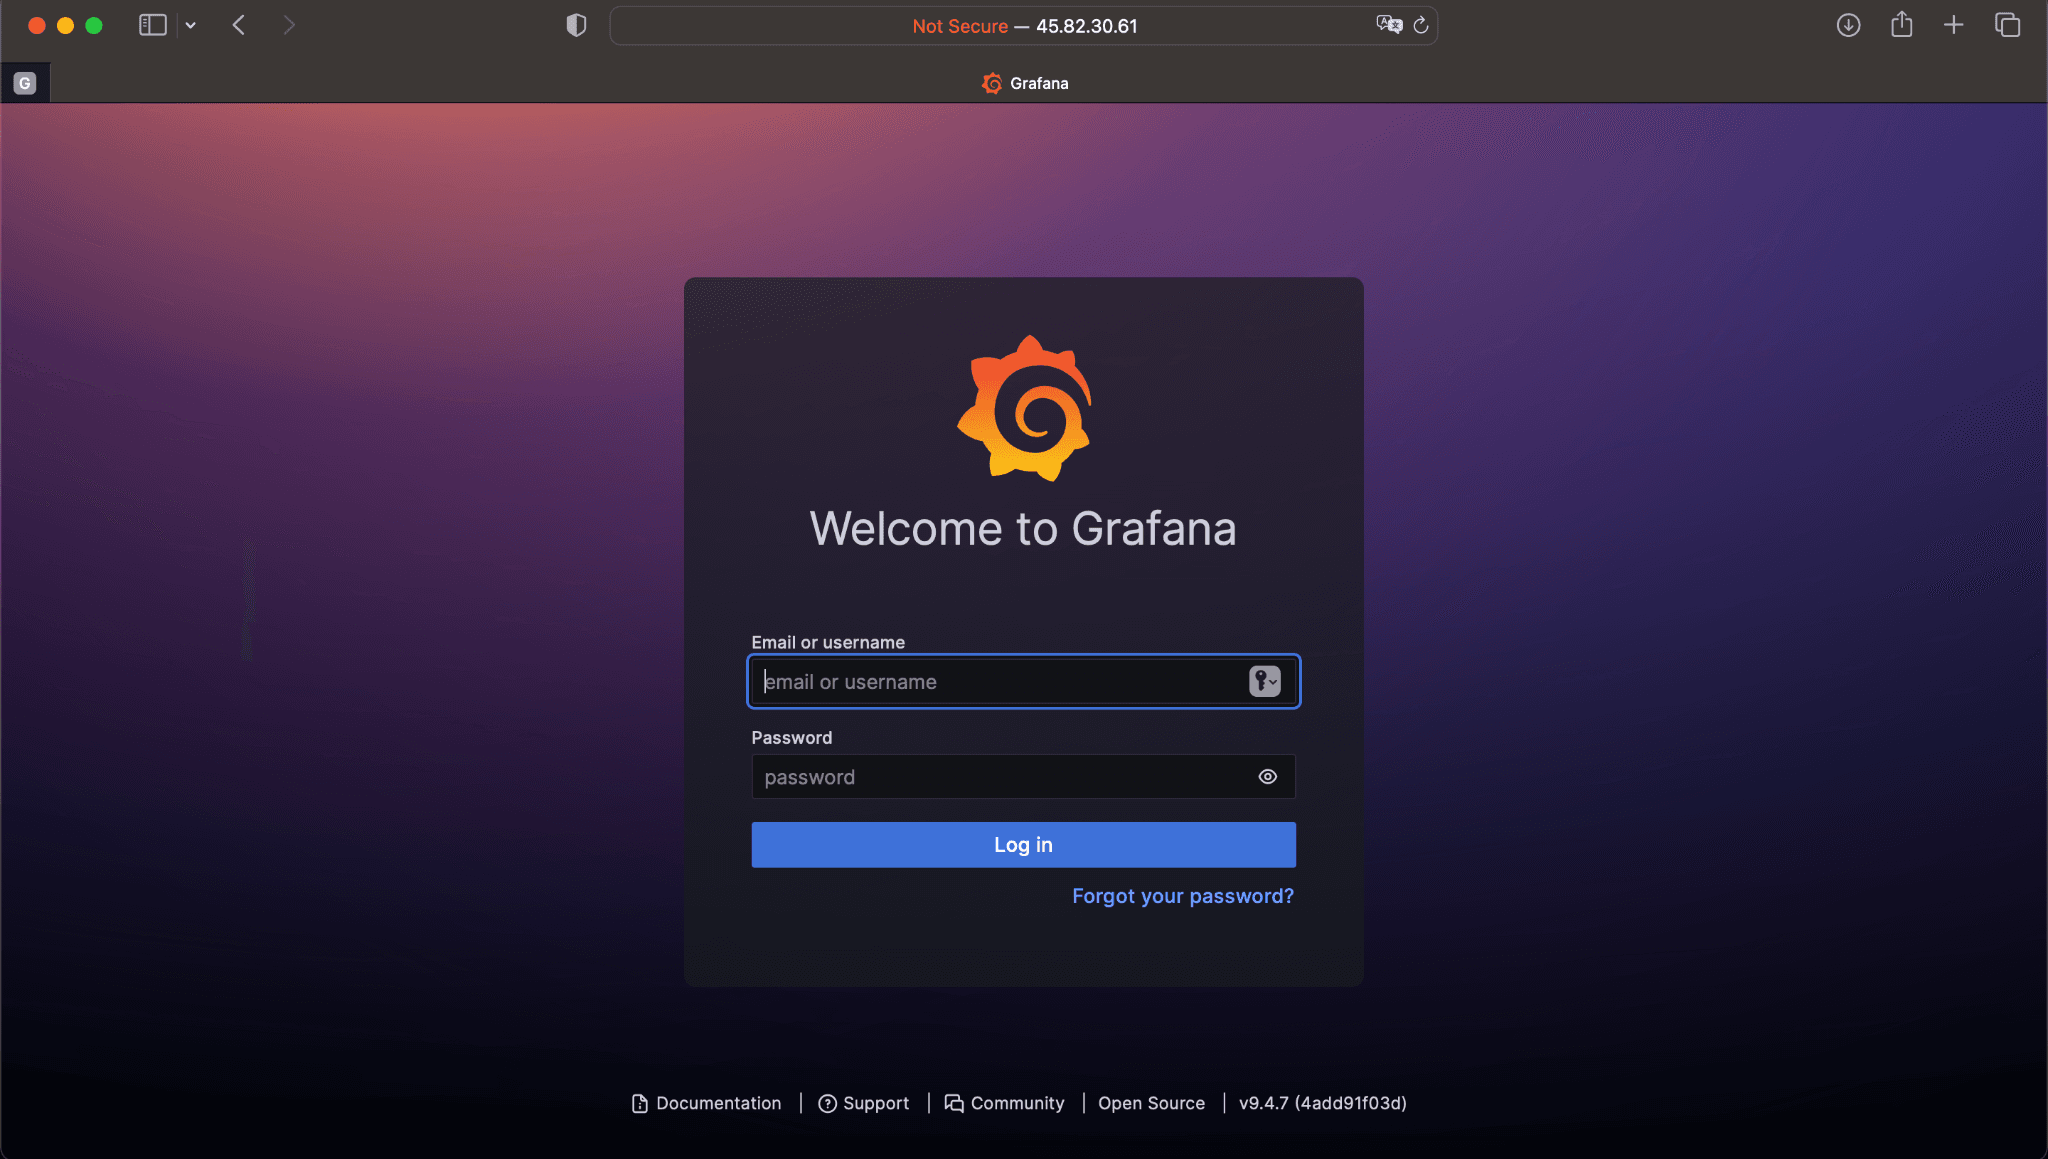
When presented with the above log in screen, enter the following credentials:
Username: admin
Password: admin
Step 3. Create a Grafana Dashboard
Now you’ve successfully accessed the Grafana dashboard, you can start creating custom dashboards to monitor your data. To create a dashboard, click on the + icon on the left side navigation menu and select Dashboard.
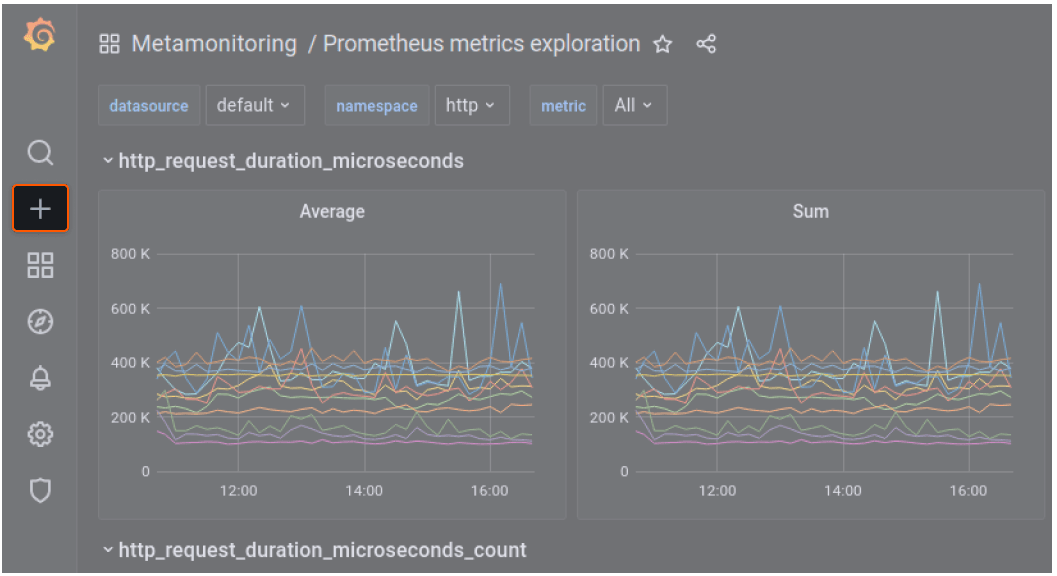
You can then add panels to your dashboard by clicking on the + icon on the top right corner of the screen.
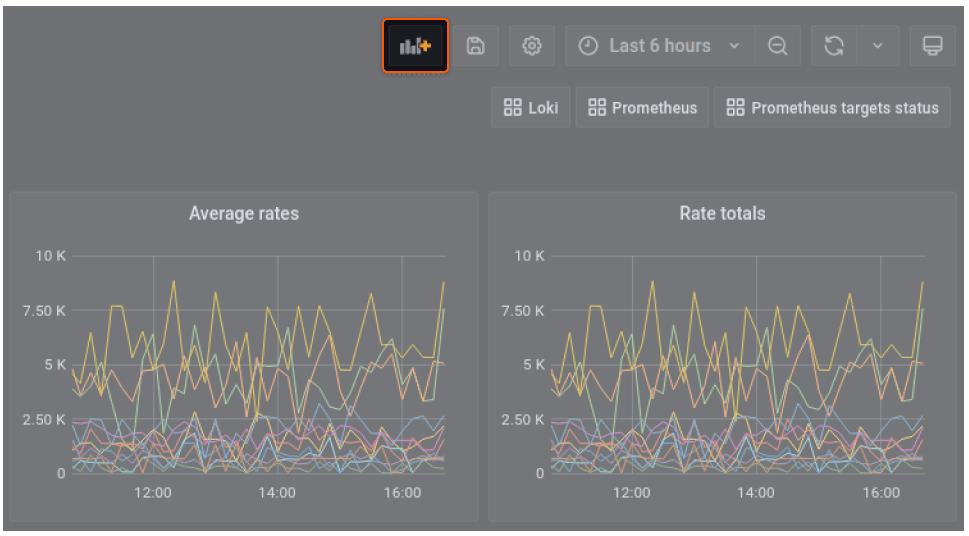
Choose the type of panel you want to add and configure it to display the data you need.
And that’s it! You’ve successfully set up Grafana on your Ubuntu server.
Conclusion
In this tutorial, we explained how to run Grafana on Ubuntu. Check out our other articles dedicated to setting up different types of software on Gcore Cloud instances:

Related articles

Panels about AI sovereignty tend to follow a predictable arc. Someone invokes GDPR. Someone else mentions hyperscalers. A politician says something optimistic. Everyone applauds and goes home.Last week's Gcore AI panel in Luxembourg didn't

An interview with Alexey Shirobokov, CEO & Founder of Mission Space with Dima Maslennikov, Head of Startups at Gcore, recorded at House of Startups, Luxembourg. At Gcore, we work closely with startups building at the edge of deep t

Building a startup is tough. Every decision about your infrastructure can make or break your speed to market and burn rate. Your time, team, and budget are stretched thin. That’s why you need a partner that helps you scale without compromis

Europe’s cloud priorities are changing fast, and rightly so. With new regulations taking effect, concerns about jurisdictional control rising, and trust becoming a key differentiator, more companies are asking a simple question: Who really

The cloud never stops. Neither do the threats.Every shift toward containers, microservices, and hybrid clouds creates new opportunities for innovation…and for attackers. Legacy security, built for static systems, crumbles under the speed, s
Subscribe to our newsletter
Get the latest industry trends, exclusive insights, and Gcore updates delivered straight to your inbox.