What is health check monitoring and how does it improve system reliability?
- By Gcore
- December 27, 2025
- 8 min read

Health check monitoring is a systematic process that tracks the availability and performance of your servers, applications, and infrastructure by sending automated requests at regular intervals. Most systems run checks every 30 to 60 seconds to catch failures quickly.
The process combines active probes with passive monitoring techniques. Active health checks send HTTP, TCP, or ICMP requests to your endpoints and evaluate responses based on status codes, response times, and content validation.
Systems typically mark an endpoint as unhealthy after two to three consecutive failed checks. They'll then remove such an endpoint from rotation until it passes the required number of successful checks to return to service.
The main benefits include improved uptime, faster incident detection, and automated failover. Organizations using health check monitoring report average downtime reductions of 40% to 60% compared to manual monitoring approaches. The system automatically routes traffic away from failed nodes, maintaining service availability without manual intervention.
Setting up health checks requires defining check intervals, timeout values, and failure thresholds that match your service requirements.
You'll need to choose between shallow checks (which verify basic connectivity) and deep checks (which validate application logic and database connections). Most teams start with 30-second intervals and 5-second timeouts, then adjust based on actual traffic patterns and failure scenarios.
Health check monitoring directly affects user experience and business continuity. A single minute of downtime can cost an enterprise dearly. This makes automated health monitoring a practical necessity for production systems.
What is health check monitoring?
Health check monitoring is the automated process of regularly testing the availability and responsiveness of servers, applications, or services to confirm they're working correctly. The system sends periodic requests to target endpoints and evaluates their responses based on predefined criteria like response time, status codes, or specific content. When a health check fails, the monitoring system can automatically reroute traffic to healthy instances, alert administrators, or trigger automated recovery processes. Modern health check systems can test endpoints every few seconds with latency thresholds as low as 100ms to catch issues before they affect users.
How does health check monitoring work?
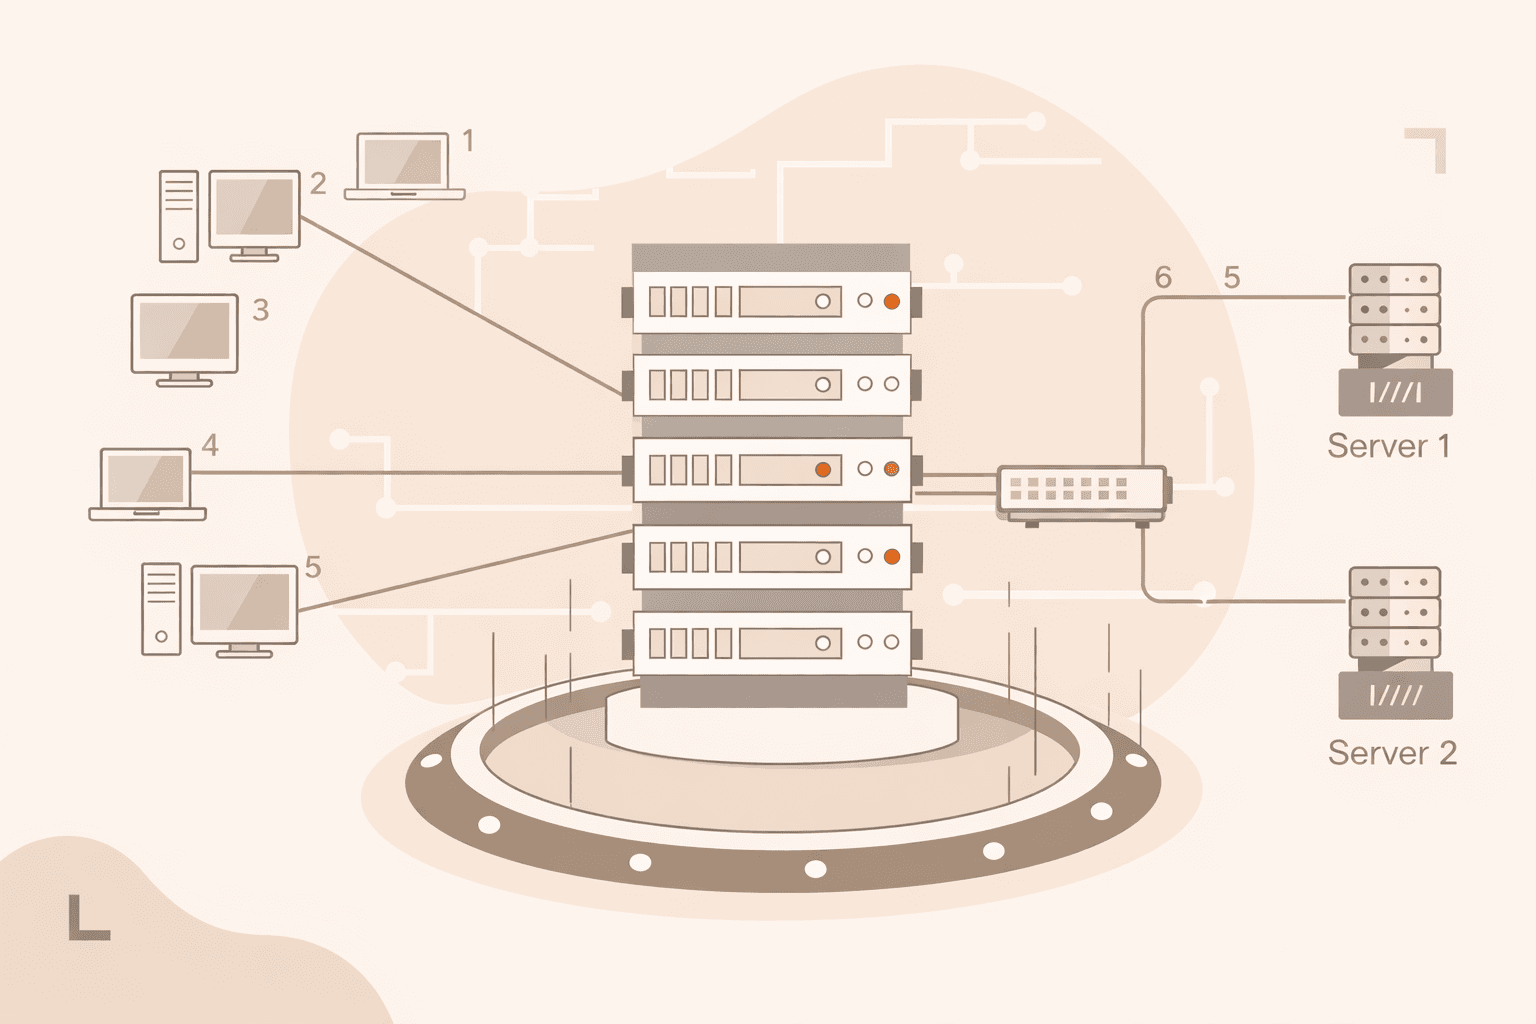
Health check monitoring works by sending automated requests to your servers or applications at regular intervals to verify they're responding correctly and performing as expected. The monitoring system sends HTTP requests, TCP connections, or ping commands to specific endpoints you configure, then evaluates the response based on criteria like status codes, response time, and returned content. If a server fails to respond within the timeout period (typically 2 to 5 seconds) or returns an error, the system marks it as unhealthy and can automatically route traffic away from it.
The process runs continuously in the background.
Most monitoring systems check endpoints every 10 to 60 seconds, depending on your configuration. When a health check fails, the system typically retries 2 or3 times to avoid false positives from temporary network issues. If the failures persist, the monitoring system triggers your configured response. This might mean removing the server from the load balancer rotation, sending alerts to your team, or spinning up replacement instances.
Modern health checks can test multiple aspects: basic connectivity, application-level functionality through custom endpoints that verify database connections or API responses, and performance metrics like response times staying under 200ms.
What are the main benefits of health check monitoring?
Health check monitoring gives organizations continuous visibility into system availability and performance. Here are the main benefits.
- Early problem detection: Health checks catch issues before users notice them, often within seconds of a failure. This proactive approach stops small problems from turning into major outages.
- Improved uptime: Automated monitoring tracks service availability around the clock, alerting your team the moment something fails. Quick responses to detected issues help you achieve 99.9% availability or higher.
- Faster recovery: Health checks show you exactly which component failed and where. This cuts diagnostic time from hours to minutes. You can automatically route traffic away from failed servers while your team makes repairs.
- Better user experience: Continuous monitoring ensures users always reach working servers. No error pages, no timeouts. This reliability builds trust and keeps customers engaged.
- Resource efficiency: Health checks identify underperforming servers that waste resources without serving traffic properly. You can reallocate or fix these systems to get more from your infrastructure.
- Cost reduction: Catching issues early prevents expensive emergency fixes and reduces revenue loss from downtime. Automated health checks also require fewer staff hours than manual monitoring.
- Performance insights: Regular health checks collect data on response times, error rates, and capacity trends. This information helps you plan upgrades and improve system design over time.
How to implement health check monitoring for your infrastructure?
You implement health check monitoring for your infrastructure by setting up automated checks that continuously verify your systems' availability, performance, and functionality.
- First, identify which components need monitoring based on criticality and user impact. Focus on customer-facing services, databases, APIs, and core infrastructure like load balancers and DNS servers.
- Next, define what "healthy" means for each component by setting specific thresholds. For example, mark a web server as healthy if it responds within 200ms with a 200 status code. Flag a database as unhealthy if connection pools exceed 80% capacity.
- Then, choose appropriate check types for each service. Use HTTP/HTTPS checks for web services, TCP checks for databases and message queues, and ping checks for network connectivity. Run checks every 30 to 60 seconds for critical services and every 2 to 5 minutes for less important ones.
- Set up monitoring from multiple geographic locations to catch region-specific issues. Check from at least three different locations to avoid false positives from network problems in a single region.
- Configure alert routing based on severity and time sensitivity. Send critical alerts (service down) immediately via SMS or phone. Warning-level issues (slow response times) can go to email or chat channels during business hours.
- Create automated responses for common failures when possible. Configure your system to restart failed services, rotate to backup instances, or remove unhealthy nodes from load balancers without manual intervention.
- Finally, establish a clear escalation path with defined response times. Set expectations like 5-minute response for critical alerts, 30 minutes for high-priority issues, and two hours for warnings.
Test your health checks regularly by simulating failures to confirm alerts fire correctly and automated responses work as expected.
What are the best practices for health check monitoring?
Best practices for health check monitoring are proven methods and standards that ensure reliable detection of service availability and performance issues. Here are the key practices you should follow.
- Define clear endpoints: Target specific URLs or API endpoints that accurately reflect your service status. Choose endpoints that test critical functions without putting heavy load on your systems.
- Set appropriate intervals: Run health checks frequently enough to catch issues quickly, but not so often that they overwhelm your infrastructure. Most critical systems work well with checks every 10 to 30 seconds, while less important services can use 1 to 5 minute intervals.
- Use multiple check types: Combine different methods like HTTP status codes, response time measurements, and content validation. This multi-layer approach catches different types of failures that a single check might miss.
- Implement timeout thresholds: Configure realistic timeout values based on normal response times for each service. A timeout of 5 to10 seconds works for most web services. Database checks typically need 2 or 3 seconds.
- Monitor from multiple locations: Run health checks from different geographic regions and network paths to detect location-specific issues. Distributed monitoring reveals problems that only affect certain users or regions.
- Track response content: Don't just verify that endpoints respond. Check that they return expected content or data structures. A 200 status code doesn't help if the service returns error messages or empty data.
- Configure failure thresholds: Require multiple consecutive failures before marking a service as down. This prevents false alarms from temporary network glitches. Three to five failed checks in a row typically indicates a real problem.
- Log check results: Store health check data for analysis and troubleshooting. These logs help you identify patterns, track mean time to recovery, and improve your monitoring strategy over time.
What tools and solutions are available for health check monitoring?
Health check monitoring tools are software applications and platforms that automatically test and verify the availability, performance, and proper functioning of your servers, applications, APIs, and network infrastructure at regular intervals. These tools work by sending synthetic requests to monitored endpoints, measuring response times, and checking status codes. They'll alert your team the moment services fail or degrade.
Modern monitoring solutions perform checks from distributed locations globally every 30 seconds to 5 minutes. This gives you real-time visibility into system health across multiple protocols, including HTTP, HTTPS, TCP, ICMP, and DNS.
How to visualize and analyze health check monitoring data?
You can visualize and analyze health check monitoring data by connecting your monitoring system to visualization tools, setting up dashboards with key metrics, and establishing alert thresholds for proactive issue detection.
- First, export your health check data from your monitoring system in a standard format like JSON or CSV. Most monitoring platforms support automated exports through APIs, which you can schedule to run every 5 to 15 minutes for near real-time analysis.
- Next, connect your data source to a visualization platform that supports time-series data. Configure the connection with proper authentication and verify that metrics like response time, uptime percentage, and error rates flow correctly into your dashboard.
- Then, create separate dashboard panels for each critical metric you want to track. Set up response time graphs with 95th and 99th percentile lines, uptime status indicators, and error rate charts that show trends over the past 24 hours and 7 days.
- After that, establish baseline thresholds for normal operation based on your historical data. Calculate average response times during peak and off-peak hours, then set warning alerts at 150% of baseline and critical alerts at 200% to catch performance degradation early.
- Set up geographic visualization maps if you monitor multiple regions or endpoints. Color-code each location by health status (green for healthy, yellow for degraded, red for down) to quickly identify regional issues.
- Configure automated reports that summarize weekly and monthly trends in availability, average response times, and incident frequency. Include comparisons to previous periods to spot gradual degradation that might not trigger immediate alerts.
- Finally, create correlation views that overlay health check data with other system metrics like CPU usage, memory consumption, and network traffic. This helps you identify root causes when health checks show problems.
Test your visualization setup by simulating a failure scenario to confirm that alerts trigger correctly and dashboards update within your expected timeframe.
What challenges should you expect with health check monitoring?
Health check monitoring challenges are the technical and operational obstacles you'll face when implementing systems to verify service availability and performance. False positives create immediate headaches. Network hiccups or temporary load spikes trigger unnecessary alerts, leading to alert fatigue across your team. Configuration complexity grows with your infrastructure. You'll need to set appropriate check intervals, timeout values, and failure thresholds for each service without creating coverage gaps.
Distributed systems add another layer of difficulty. Health checks must account for eventual consistency, partial failures, and cascading issues where one failing component affects others downstream. These challenges require careful planning to ensure your monitoring system remains reliable and actionable.
Frequently asked questions
What's the difference between health check monitoring and uptime monitoring?
Health check monitoring tests specific application functionality and dependencies. Uptime monitoring only verifies if a server responds to requests.
Health checks examine database connections, API endpoints, and service dependencies with detailed status codes. Uptime monitoring simply pings a URL to confirm basic availability. It's a narrower focus that tells you if something is up, but not whether it's actually working properly.
How often should health checks run?
For most applications, you'll want health checks running every 5 to 30 seconds. Active checks at 10 to15 second intervals give you the best balance between quick failure detection and system overhead.
If you're running critical services that need sub-minute failover, use more frequent checks under 5 seconds. For less critical systems, you can extend intervals to 60 seconds without issues.
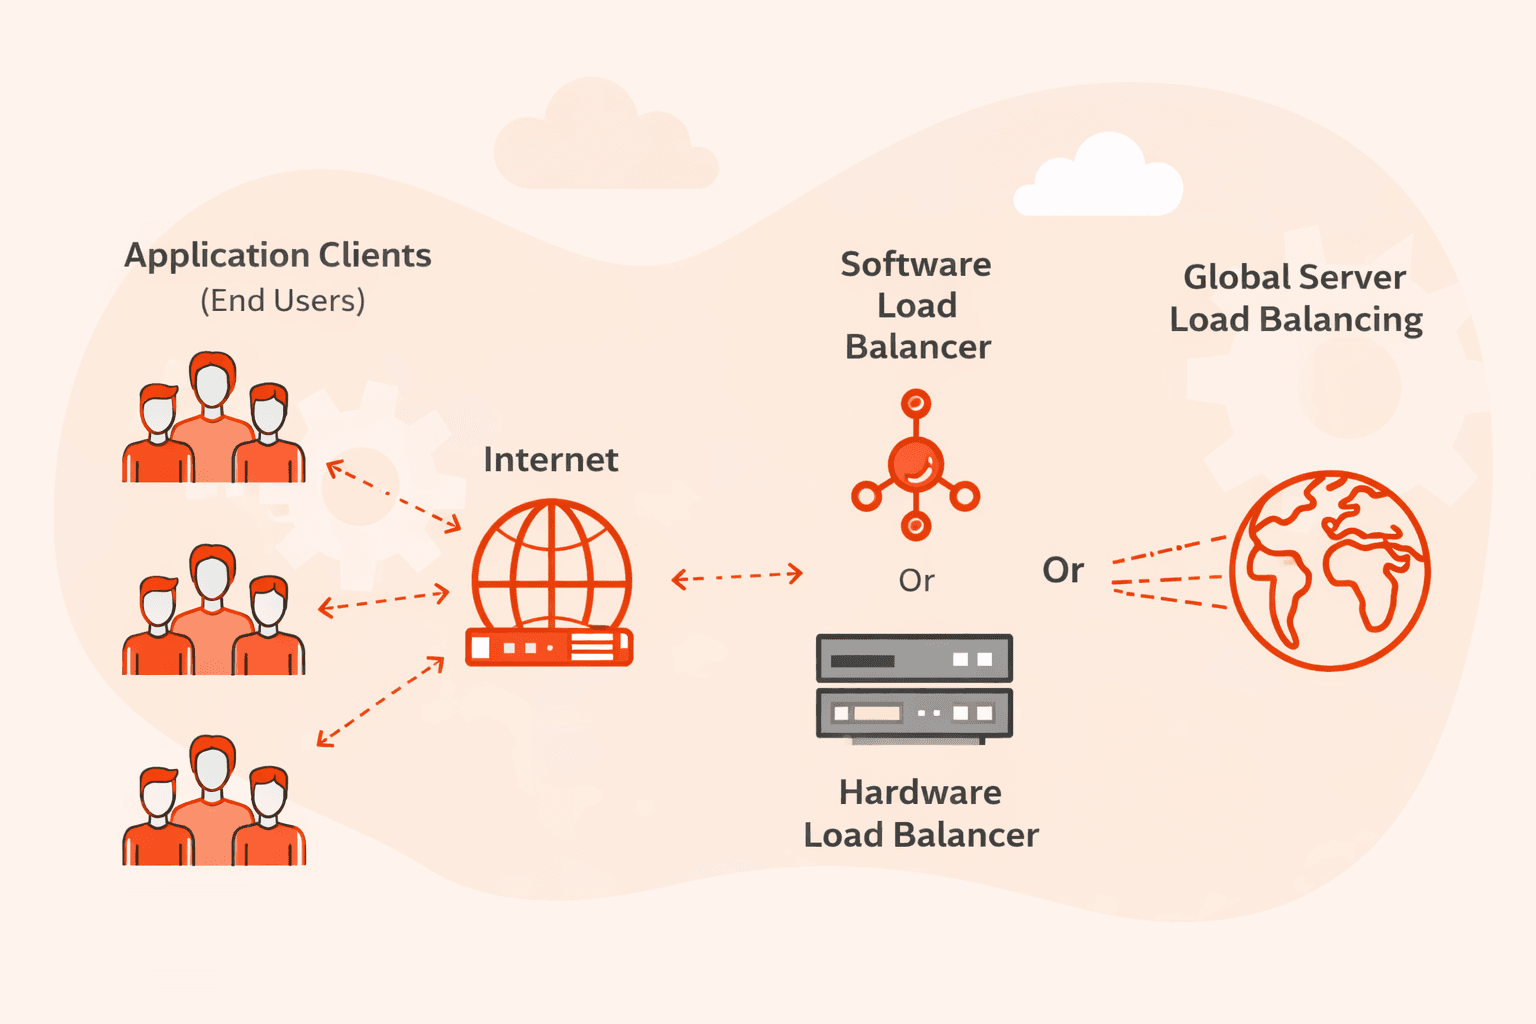
What happens when a health check fails?
When a health check fails, the load balancer automatically stops routing traffic to that server until it passes later health checks. The server stays in rotation for existing connections but won't receive new requests. This typically lasts 30 to 60 seconds, depending on your retry interval settings.
Can health check monitoring work with legacy systems?
Yes, health check monitoring works with legacy systems through standard protocols like HTTP, TCP, and ICMP that many older systems support. If your system doesn't have native API support, you'll need to add adapters or agents to enable monitoring.
What metrics should a health check monitor?
Health checks should monitor response time (typically under 200ms), HTTP status codes (200-299 range), endpoint availability, and error rates to confirm service health. For comprehensive monitoring, you'll also want to track CPU usage, memory consumption, database connectivity, and dependency service status.
How does health check monitoring integrate with incident management?
Health check monitoring integrates with incident management by automatically triggering alerts and creating tickets when checks fail. It routes these alerts to on-call teams based on severity rules you've configured. Most systems send notifications through multiple channels like Slack, PagerDuty, and email, and they include diagnostic data (response times, error codes) to help your team resolve issues faster.
Is health check monitoring suitable for small businesses?
Yes, health check monitoring works well for small businesses. It prevents costly downtime and maintains customer trust by catching issues before they affect users. You'll get automated alerts the moment something goes wrong, so you can fix problems quickly and keep your services running smoothly.
Related articles
Subscribe to our newsletter
Get the latest industry trends, exclusive insights, and Gcore updates delivered straight to your inbox.