How we lowered the bitrate for live and VOD streaming by 32.5% without sacrificing quality
- March 9, 2023
- 5 min read

We’ve been experimenting with transcoding settings to lower the bitrate without losing video quality. And we’ve succeeded. Here are Gcore’s current results in comparison with our competitors:
| Video quality | Gcore, Mbps | MUX*, Mbps | Bitmovin*, Mbps | Cloudflare*, Mbps | Dacast*, Mbps |
| 4K | 14 | — | 16 | — | 20 |
| 2K | 7.2 | — | — | — | 15 |
| 1080p | 4.05 | 4.8 | 4.8 | 3.6 | 7 |
| 720p | 1.8 | 2.5 | 2.4 | 1.8 | 5.2 |
| 480p | 0.8 | 1.6 | 1.2 | 1 | 2.1 |
| 360p | 0.45 | 1 | 0.8 | 0.7 | 1.5 |
| 240p | 0.2 | 0.7 | 0.4 | 0.5 | 0.5 |
* Average data obtained from platform testing.
Users can now watch video in SD and HD quality, even with a poor internet connection. The chart below is a visual demonstration of quality differences on the “encoding ladder” between standard and optimized transcoding settings.
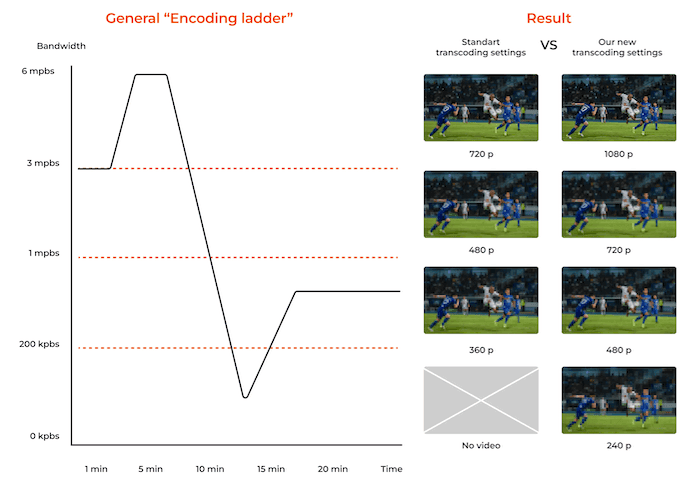
Decreasing the bitrate has also made streaming more cost-effective for our clients: the lower the Mbps, the less traffic is consumed, which in turn lowers the total cost of streaming.
In this article, we’ll discuss why we took on video optimization and how the video bitrate quality ratio has changed. We’ll also show metrics that support the results.
Why working to lower bitrate matters
One of the main tenets of building online video solutions is adaptive streaming. You air a few broadcasts simultaneously with varying video qualities and bitrates. The user’s player can switch between them: if the internet speed dips, the quality decreases; as soon as the speed recovers, the quality improves.
When setting the video and bitrate quality, Apple recommends starting with the settings in the table below, and then selecting what you need for specific circumstances.
| Video quality | Bitrate after transcoding |
| 1080p | 6 Mbps |
| 720p | 3 Mbps |
| 480p | 1.1 Mbps |
| 360p | 0.365 Mbps |
| 240p | 0.145 Mbps |
In practice, some streaming providers stop with these settings. But the values above are not ideal. We’ll illustrate this using a soccer game as an example.
A viewer decides to watch a soccer game on their phone. They have a good connection that lets them watch in 1080p. If we use Apple’s recommendations, the viewer will receive the stream at 6 Mbps, and for the game’s 120 minutes will consume 5.4 GB of traffic. This goes beyond the capabilities of many unlimited mobile plans. The viewer can use up an entire month’s worth of traffic for this one game.
6 Mbps / 8 b * 60 s * 120 m = 5400 MB
But what if we could reduce the bitrate by 0.5 Mbps without sacrificing quality? In the case of our soccer game, reducing the bitrate by 0.5 Mbps saves the viewer 450 MB overall.
5.5 Mbps / 8 b * 60 s * 120 m = 4950 MB
5 Mbps / 8 b * 60 s * 120 m = 4500 MB
4.5 Mbps / 8 b * 60 s * 120 m = 4050 MB
4 Mbps / 8 b * 60 s * 120 m = 3600 MB
This will also save the livestream provider money. In most cases, video content is delivered through a CDN, and the provider pays for the delivery on a PAYG basis: the more data is delivered, the more it costs. Reducing traffic volumes can save on that delivery. And if the provider prefers VOD streaming, this can lower the amount of space the video will take up in storage.
How we optimized video
During one stage of development for Gcore’s streaming platform, we determined the optimal set of video profiles for us.
| Video quality (H.264) | Bitrate after transcoding |
| 4K | 14 Mbps |
| 2K | 10.8 Mbps |
| 1080p | 6.1 Mbps |
| 720p | 2.7 Mbps |
| 480p | 1.15 Mbps |
| 360p | 0.68 Mbps |
| 240p | 0.3 Mbps |
But coding technology is constantly advancing. This opened up new possibilities. We decided to experiment with transcoding settings to reduce the bitrate without losing video quality as a result.
For testing, we picked out 50 diverse videos and started choosing parameters. Below are examples of videos we tested.
First, we processed each video using the old transcoding settings. Then we changed the settings and compared the new video with the old one. The key evaluation criteria were video quality, the size of the transmitted video file, and transcoding speed.

We compared quality using objective metrics and algorithms:
- VMAF
- PSNR
- SSIM
- Ciede2000
- Cambi
Results
After a few months of testing, we landed on the required settings: we managed to lower the bitrate without losing any perceived video quality. Of course, the video quality did fall slightly, but the human eye is not able to distinguish these changes, which was confirmed by metrics as well as the results of blind testing.
How much the bitrate dropped
The results of the changes are shown in the table below:
| Video quality | Before | After | Difference |
| 4K | 14 Mbps | 14 Mbps | −0% |
| 2K | 10.8 Mbps | 7.2 Mbps | −33% |
| 1080p | 6.1 Mbps | 4.05 Mbps | −33% |
| 720p | 2.7 Mbps | 1.8 Mbps | −33% |
| 480p | 1.15 Mbps | 0.8 Mbps | −30% |
| 360p | 0.68 Mbps | 0.45 Mbps | −33% |
| 240p | 0.3 Mbps | 0.2 Mbps | −33% |
Perceived quality did not change as a result of this reduction. Below is a slider with one frame from a 1080p video. The version on the left shows the frame before transcoding optimization, and the version on the right shows the frame after.
What these results mean for viewers and clients
The average difference between the old and new bitrate values was 32.5%. This means that with the new transcoding settings:
- users consume 32.5% less traffic while watching video;
- clients using a CDN for streaming pay 32.5% less to deliver video content; and
- clients providing VOD streaming get 32.5% more storage space.
Metrics: The difference between the new and old transcoding settings
Transcoding speed

Transcoded file size

VMAF
VMAF is an objective evaluation metric of perceived video quality that was developed by Netflix. The integral estimate obtained from analysis considers the degree of similarity between the original image and the modified image. The closer the VMAF is to 100, the better. Deterioration in image quality is perceivable to the human eye at intervals of 5. In our case, when comparing the original and transcoded videos, the VMAF score averaged a 97. In other words, the differences between the two videos being tested was imperceptible to the human eye. The results of comparing the old and new transcoding settings can be seen as percentages in the graph below:

PSNR is the peak signal-to-noise ratio. PSNR determines the level of distortion during compression and includes the mean squared error (MSE) calculation. Accepted values range from 0 to 100 and are measured in decibels on a logarithmic scale. The higher the value, the more detail is preserved in the video sequences after compression, translating to higher quality. The average PSNR in our case was 49. The results of comparing the old and new transcoding settings can be seen as percentages in the graph below:
PSNR Y

PSNR Cb

PSNR Cr

PSNR HVS Y

PSNR HVS Cb

PSNR HVS Cr

PSNR HVS

SSIM is an image quality evaluation metric for three criteria: luminance, contrast, and structure. Accepted values are between 0 and 1, and the higher the value, the lower the distortion and the higher the quality. This is one of the first successful metrics that most closely corresponds to the human perception of an image, as confirmed in many studies. The average SSIM in our case was 0.9975. The results of comparing the old and new transcoding settings can be seen as percentages in the graph below:
Float SSIM

Float MS SSIM

Ciede2000 is a color difference formula that numerically expresses the difference between two colors in colorimetry. The average Ciede2000 in our case was 47.

CAMBI is a banding artifact (contouring) detector from Netflix. CAMBI scores start at 0, meaning no banding is detected. Higher CAMBI scores mean that more visible banding artifacts are identified. The maximum CAMBI that can be observed in a sequence is 24 (meaning the video is unwatchable). As a rule, a CAMBI score around 5 means that banding is starting to become slightly annoying. The average CAMBI score in our case was 1.5. The results of comparing the old and new transcoding settings can be seen as percentages in the graph below:

Conclusion
Long months of experimenting helped us make streaming more efficient. Bitrate reduction allows clients to save on content delivery though a CDN and on video storage, while viewers use less internet traffic watching videos.
Compared to competitors, Gcore’s new bitrate turned out to be lower for most video quality values:
| Video Quality | Gcore, Mbps | MUX*, Mbps | Bitmovin*, Mbps | Cloudflare*, Mbps | Dacast*, Mbps |
| 4K | 14 | — | 16 | — | 20 |
| 2K | 7.2 | — | — | — | 15 |
| 1080p | 4.05 | 4.8 | 4.8 | 3.6 | 7 |
| 720p | 1.8 | 2.5 | 2.4 | 1.8 | 5.2 |
| 480p | 0.8 | 1.6 | 1.2 | 1 | 2.1 |
| 360p | 0.45 | 1 | 0.8 | 0.7 | 1.5 |
| 240p | 0.2 | 0.7 | 0.4 | 0.5 | 0.5 |
* Average data obtained from platform testing.
We don’t plan to stop there. We’re continuing to improve our solutions to make streaming even more efficient and convenient for our clients.

Related articles


For many startups, infrastructure decisions are mostly about performance, pricing, and developer experience. For Melious AI, they are also about trust.Melious AI is a German startup building a European AI platform around privacy, transparen


At Gcore, delivering exceptional streaming experiences to users across our global network is at the heart of what we do. We're excited to share how we're taking our CDN performance monitoring to new heights through our partnership with AVEQ

Subscribe to our newsletter
Get the latest industry trends, exclusive insights, and Gcore updates delivered straight to your inbox.