Purpose
The Dashboard provides a consolidated operational view of traffic inspected by WAAP. It helps DevSecOps teams quickly understand the security posture of protected applications and APIs and identify anomalies in traffic patterns. The Dashboard supports two scopes of analysis:- Account-level view — a global overview across all protected domains in the WAAP account. This view helps teams understand overall traffic volume, attack pressure, and the effectiveness of protection policies across the entire application portfolio.
- Domain-level view — a focused perspective for a single protected domain. This view allows teams to analyze traffic behavior, attack patterns, and mitigation actions for a specific application or API.
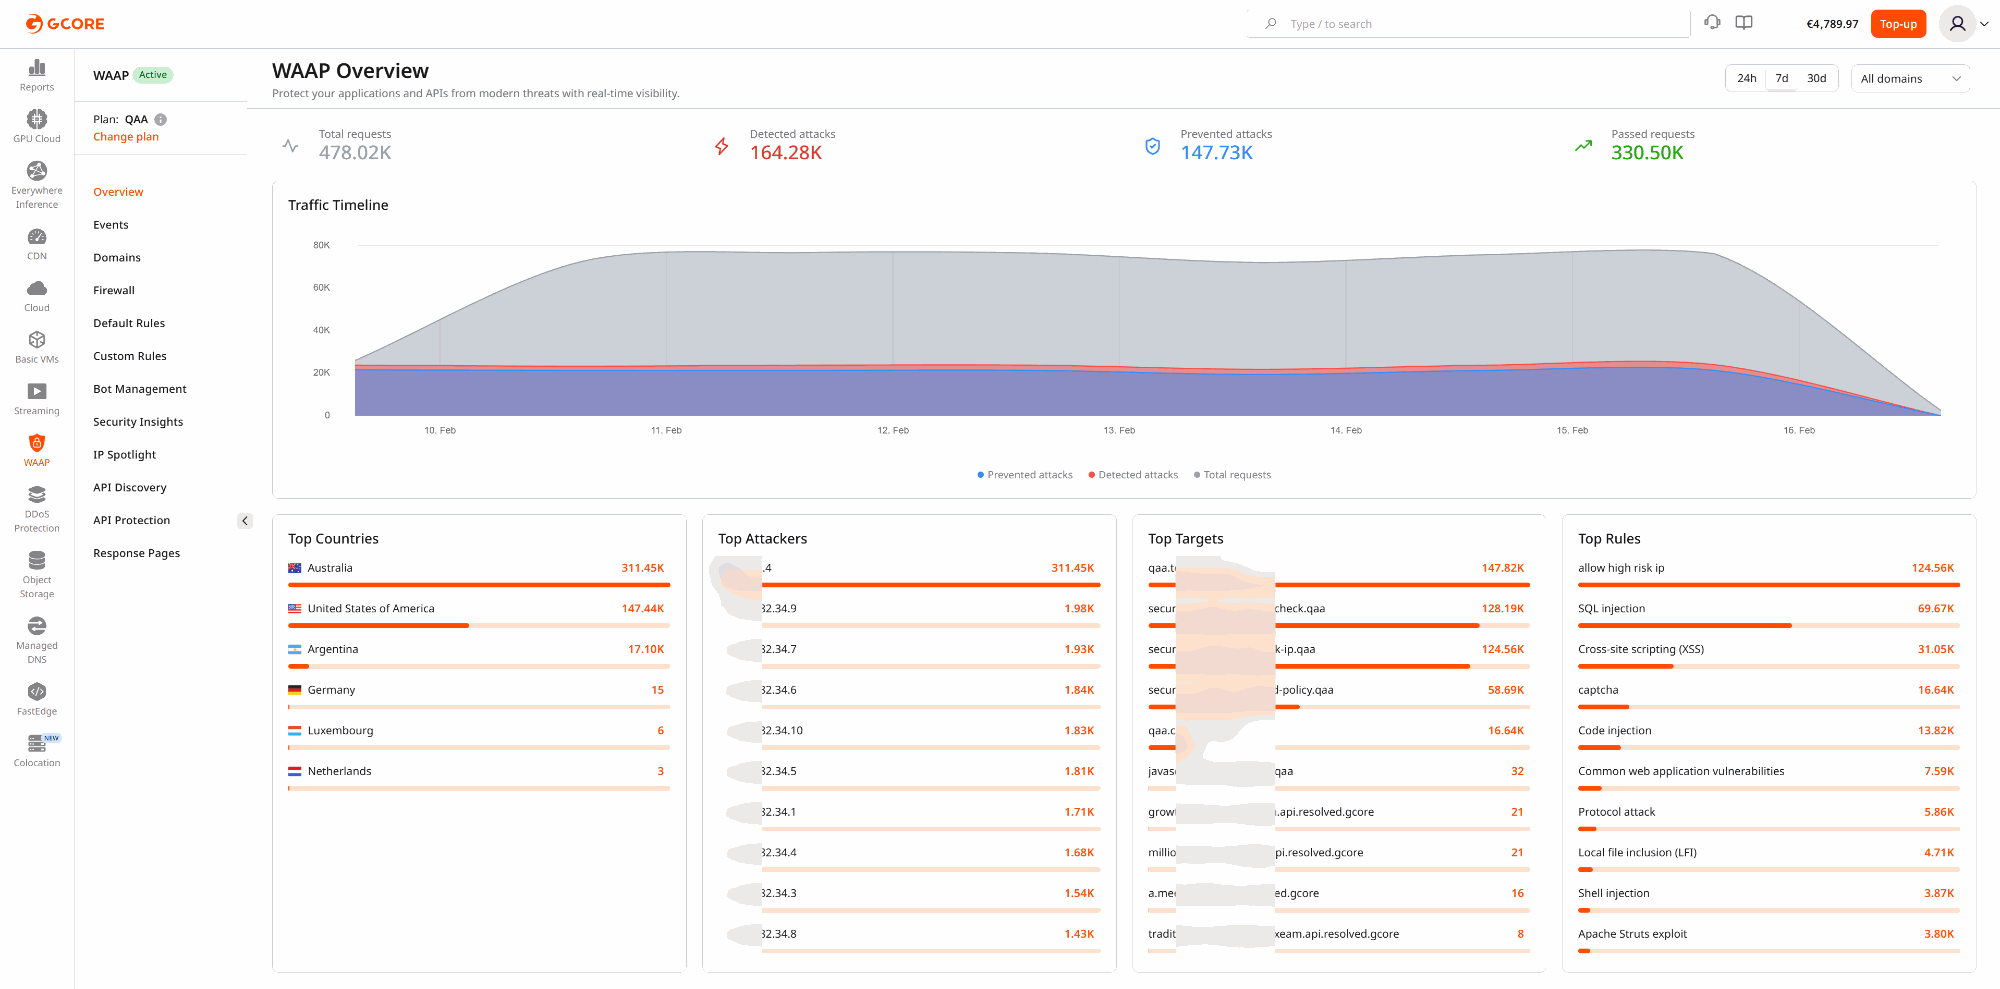
- Total requests
- Detected attacks
- Prevented attacks
- Passed requests
- Traffic timeline
- Top activity indicators such as source countries, attackers, targets, and triggered rules
Top activity widgets
The lower section of the Dashboard contains four top-activity widgets that summarize where attacks originate, who is generating them, what they target, and which rules respond to them. Together they provide a fast overview of the most significant threats without requiring a manual search through Events. All four widgets reflect blocked and suppressed (malicious) traffic and respect the currently selected time range and domain scope. Changing the time range or switching between account-level and domain-level views updates every widget accordingly. Each entry in a widget is clickable. Selecting an entry opens Events pre-filtered by that value, allowing teams to move directly from a high-level indicator to the underlying requests.| Widget | What it shows | Clicking an entry |
|---|---|---|
| Top Countries | The countries generating the highest volume of blocked requests. | Opens Events filtered by that country. |
| Top Attackers | The IP addresses with the highest number of blocked requests. Each entry includes a tooltip with the IP address, country flag, and organization name. | Opens Events filtered by that IP address. |
| Top Targets | The domains or endpoints receiving the most attacks. | Opens Events filtered by that domain. |
| Top Rules | The security rules triggered most frequently. | Opens Events filtered by that rule. |
Operational scenarios
Monitoring production security posture
Security engineers often use the Dashboard as a daily operational checkpoint. For example, a team reviewing the previous 24 hours may notice a spike in detected attacks without a corresponding increase in prevented attacks. This can indicate that a protection rule is operating in monitoring mode or that enforcement policies need adjustment. This scenario helps teams:- validate recent rule or policy deployments
- detect drift in security configuration
- identify assets that require stricter protection
Identifying the most targeted application
Organizations frequently protect multiple domains, APIs, and services within a single WAAP account. The Dashboard helps teams determine which assets are currently under the highest attack pressure. For example:- a payment API may be receiving credential-stuffing attempts
- an authentication endpoint may be targeted by brute-force automation
- a public API may attract scanning or enumeration activity
Correlating traffic spikes with security activity
Traffic spikes are not always malicious. They can be caused by product launches, marketing campaigns, automated crawlers, or partner integrations. The Dashboard helps distinguish between legitimate traffic growth and hostile automation by displaying request volume together with detected and prevented attacks on the same timeline. Example use cases include:- monitoring application behavior during product releases
- distinguishing attack waves from legitimate demand spikes
- performing rapid incident triage during abnormal traffic events
Communicating security value to stakeholders
Account-level Dashboard metrics provide a clear operational summary that can be used in executive briefings, customer demonstrations, or internal reporting. Teams often use these views to demonstrate:- the volume of malicious traffic intercepted by WAAP
- the most frequently targeted assets
- the effectiveness of security policies over time
Recommended workflow
A common investigation workflow starts with the Dashboard:- Review traffic and attack trends.
- Identify abnormal spikes or unusual activity.
- Narrow the relevant time range.
- Pivot into Events for detailed request analysis.