Reports overview
Reports is a section in the Gcore Customer Portal that displays statistics on your CDN resources. There are two tabs in the section:- Statistics: Basic reports are available on all tariffs
- Advanced Analytics: Paid option
NoteWe recommend requesting statistics two days or more after the desired period ends to ensure you receive the most complete data. Requesting statistics immediately may result in incomplete data.
Statistics
To view basic statistics: 1. Go to the Statistics page.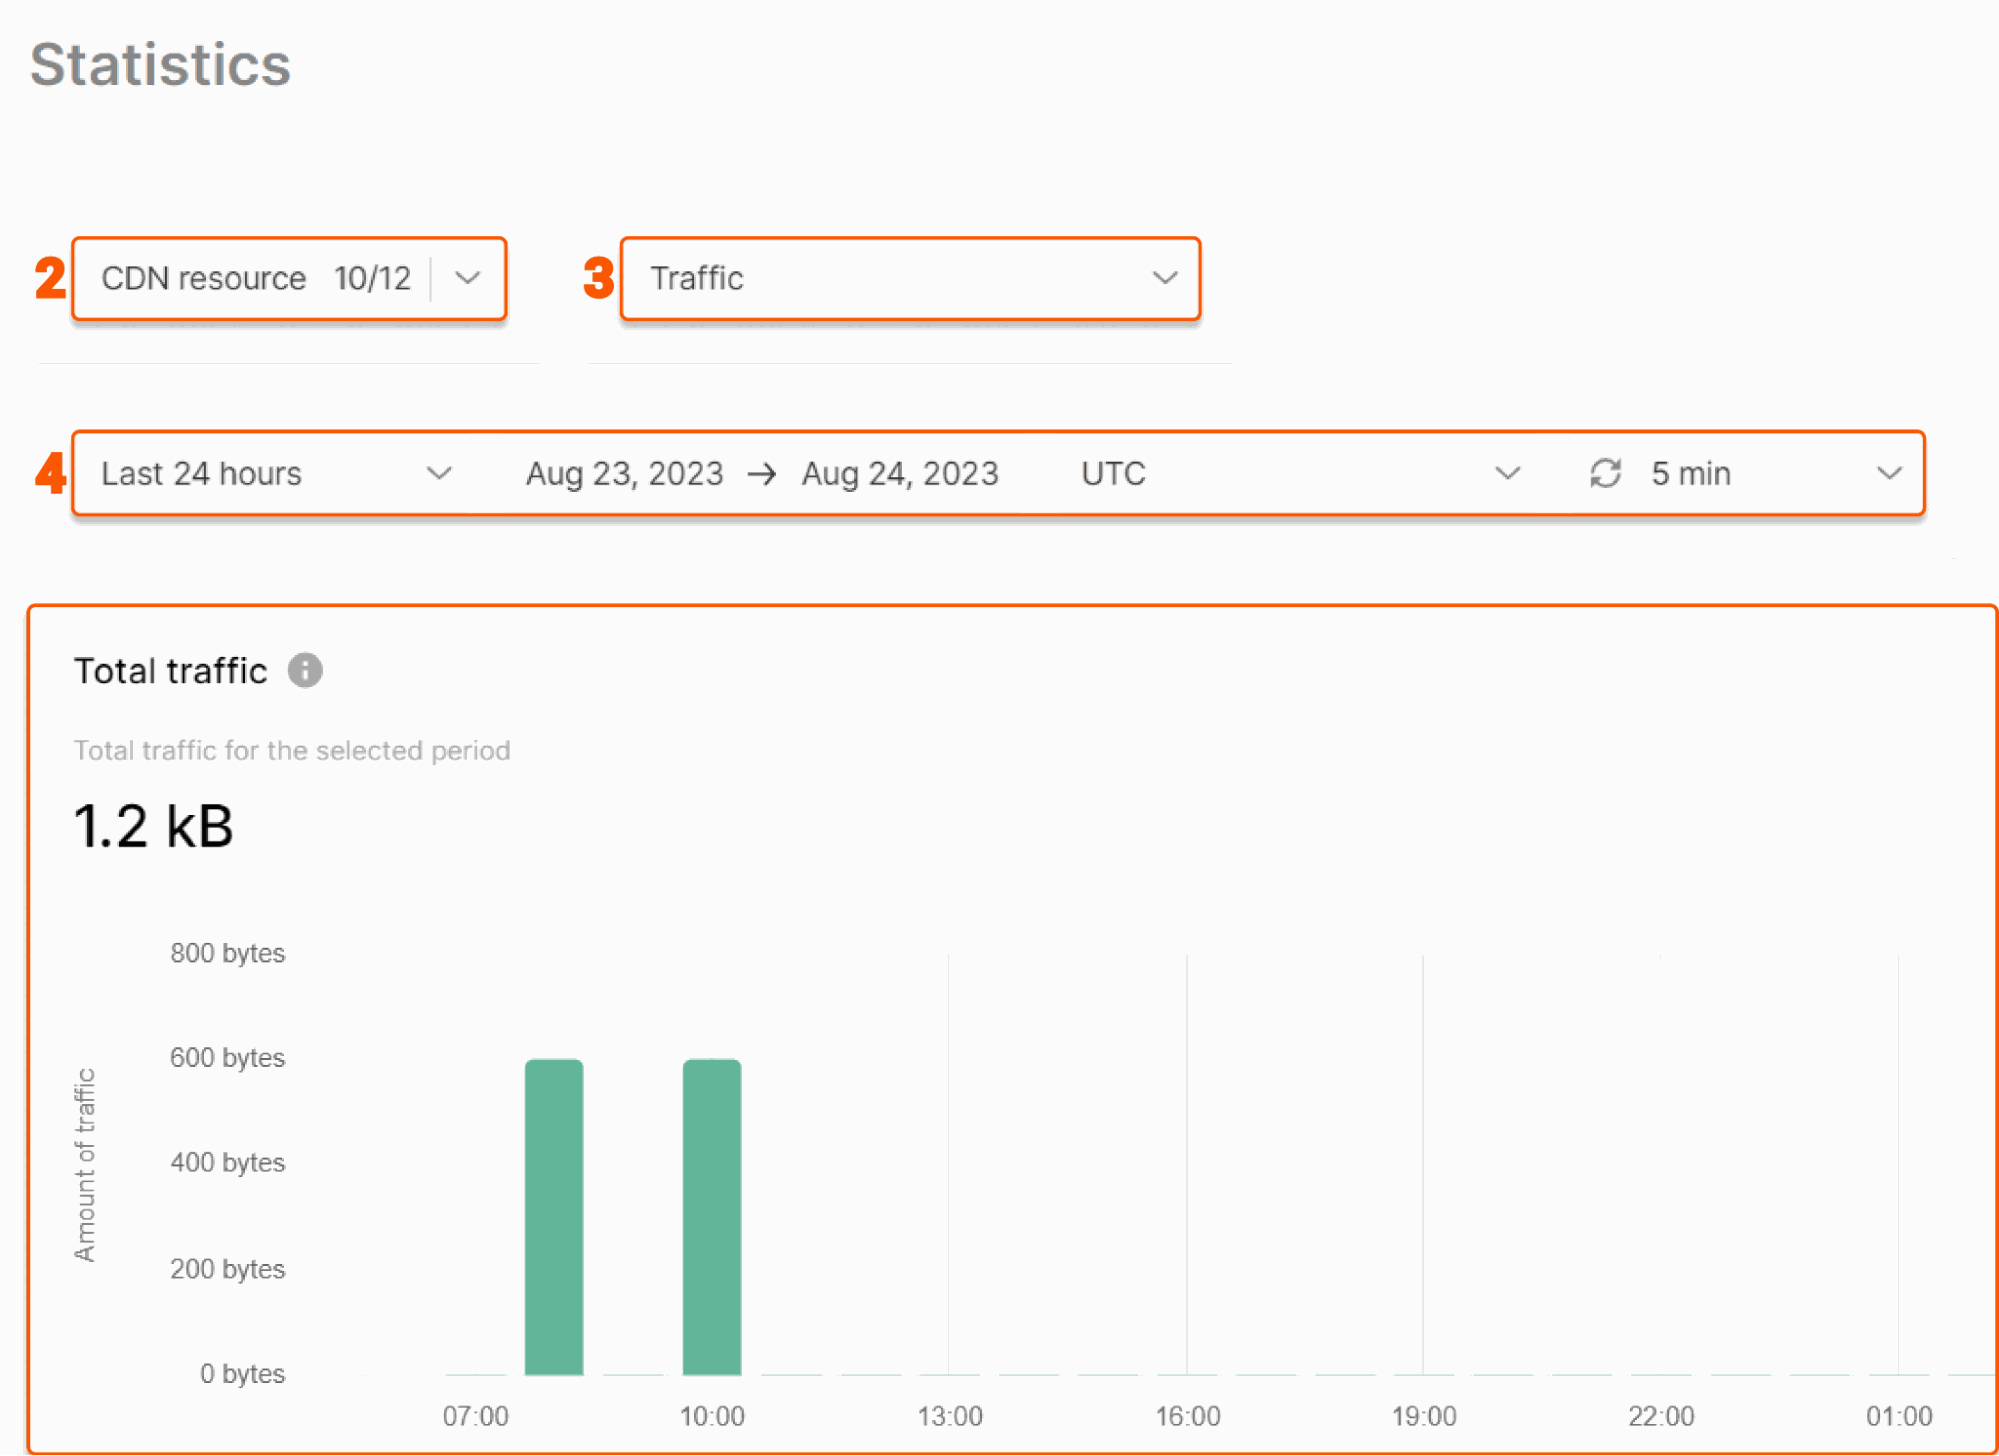
- Aggregated data: Traffic volume and bandwidth information for the last three months
- Traffic
- Bandwidth
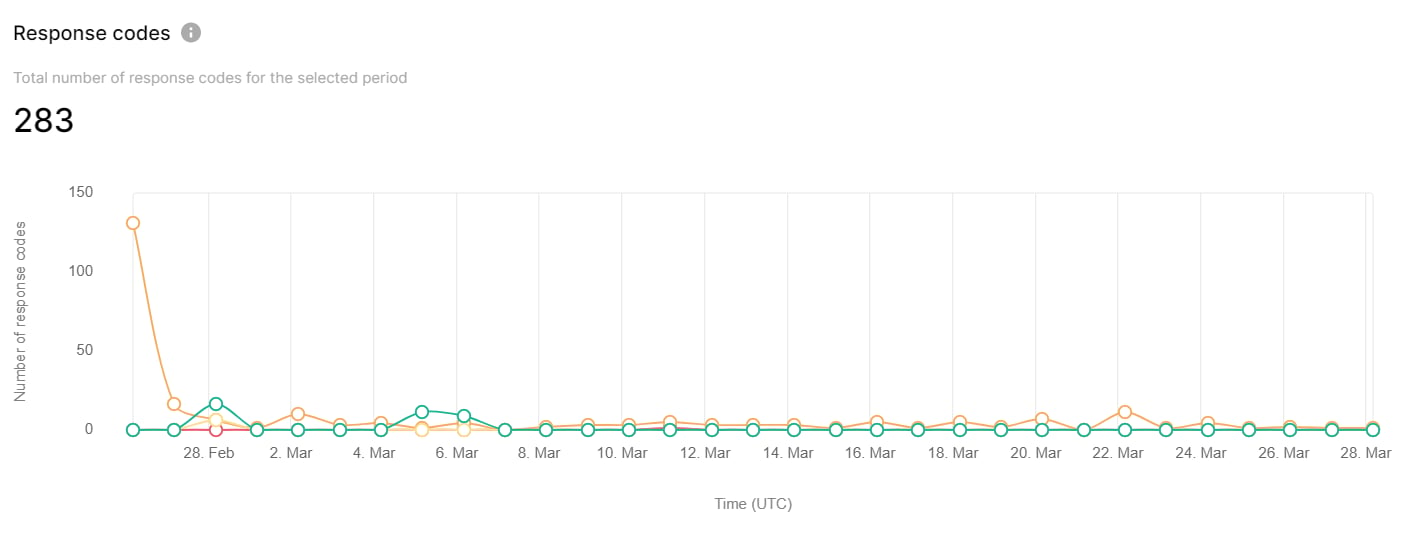
- Response codes
- Cache hit ratio
- Requests
- Traffic by region: Traffic from servers in different regions
- Traffic by country: Traffic from the five countries with the highest traffic
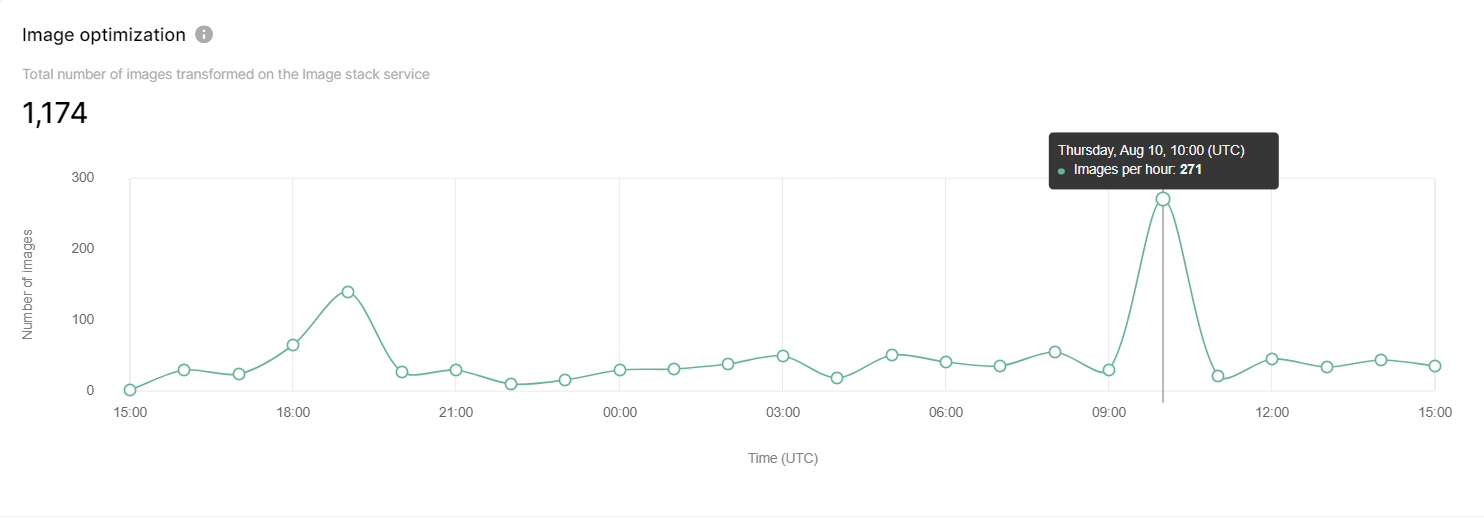
- Image optimization: Hourly count of WebP conversions
- Request time: Time elapsed in seconds between the first bytes of a request being processed and logging after the last bytes were sent to a user
- Upstream response times: Seconds to receive a response from an Origin
Advanced Analytics
Advanced Analytics overview
Advanced Analytics is a set of reports on requests, traffic, and unique visitors. Data is calculated based on end-user requests. You can filter information with five filters (Countries, Directories, Browsers, Devices, and Operating systems.)NoteAdvanced Analytics is a paid option.
How to get Advanced Analytics
To activate Advanced Analytics, contact us via Gcore Support or write to your account manager. You can enable all filters, or opt for only those required. After activation, it takes around 24 hours to collect statistics and display the data correctly. Before activation of Advanced Analytics reports, the Advanced Analytics tab displays examples of reports with random data.Manage Advanced Analytics
To view advanced reports: 1. Go to the Advanced Analytics page.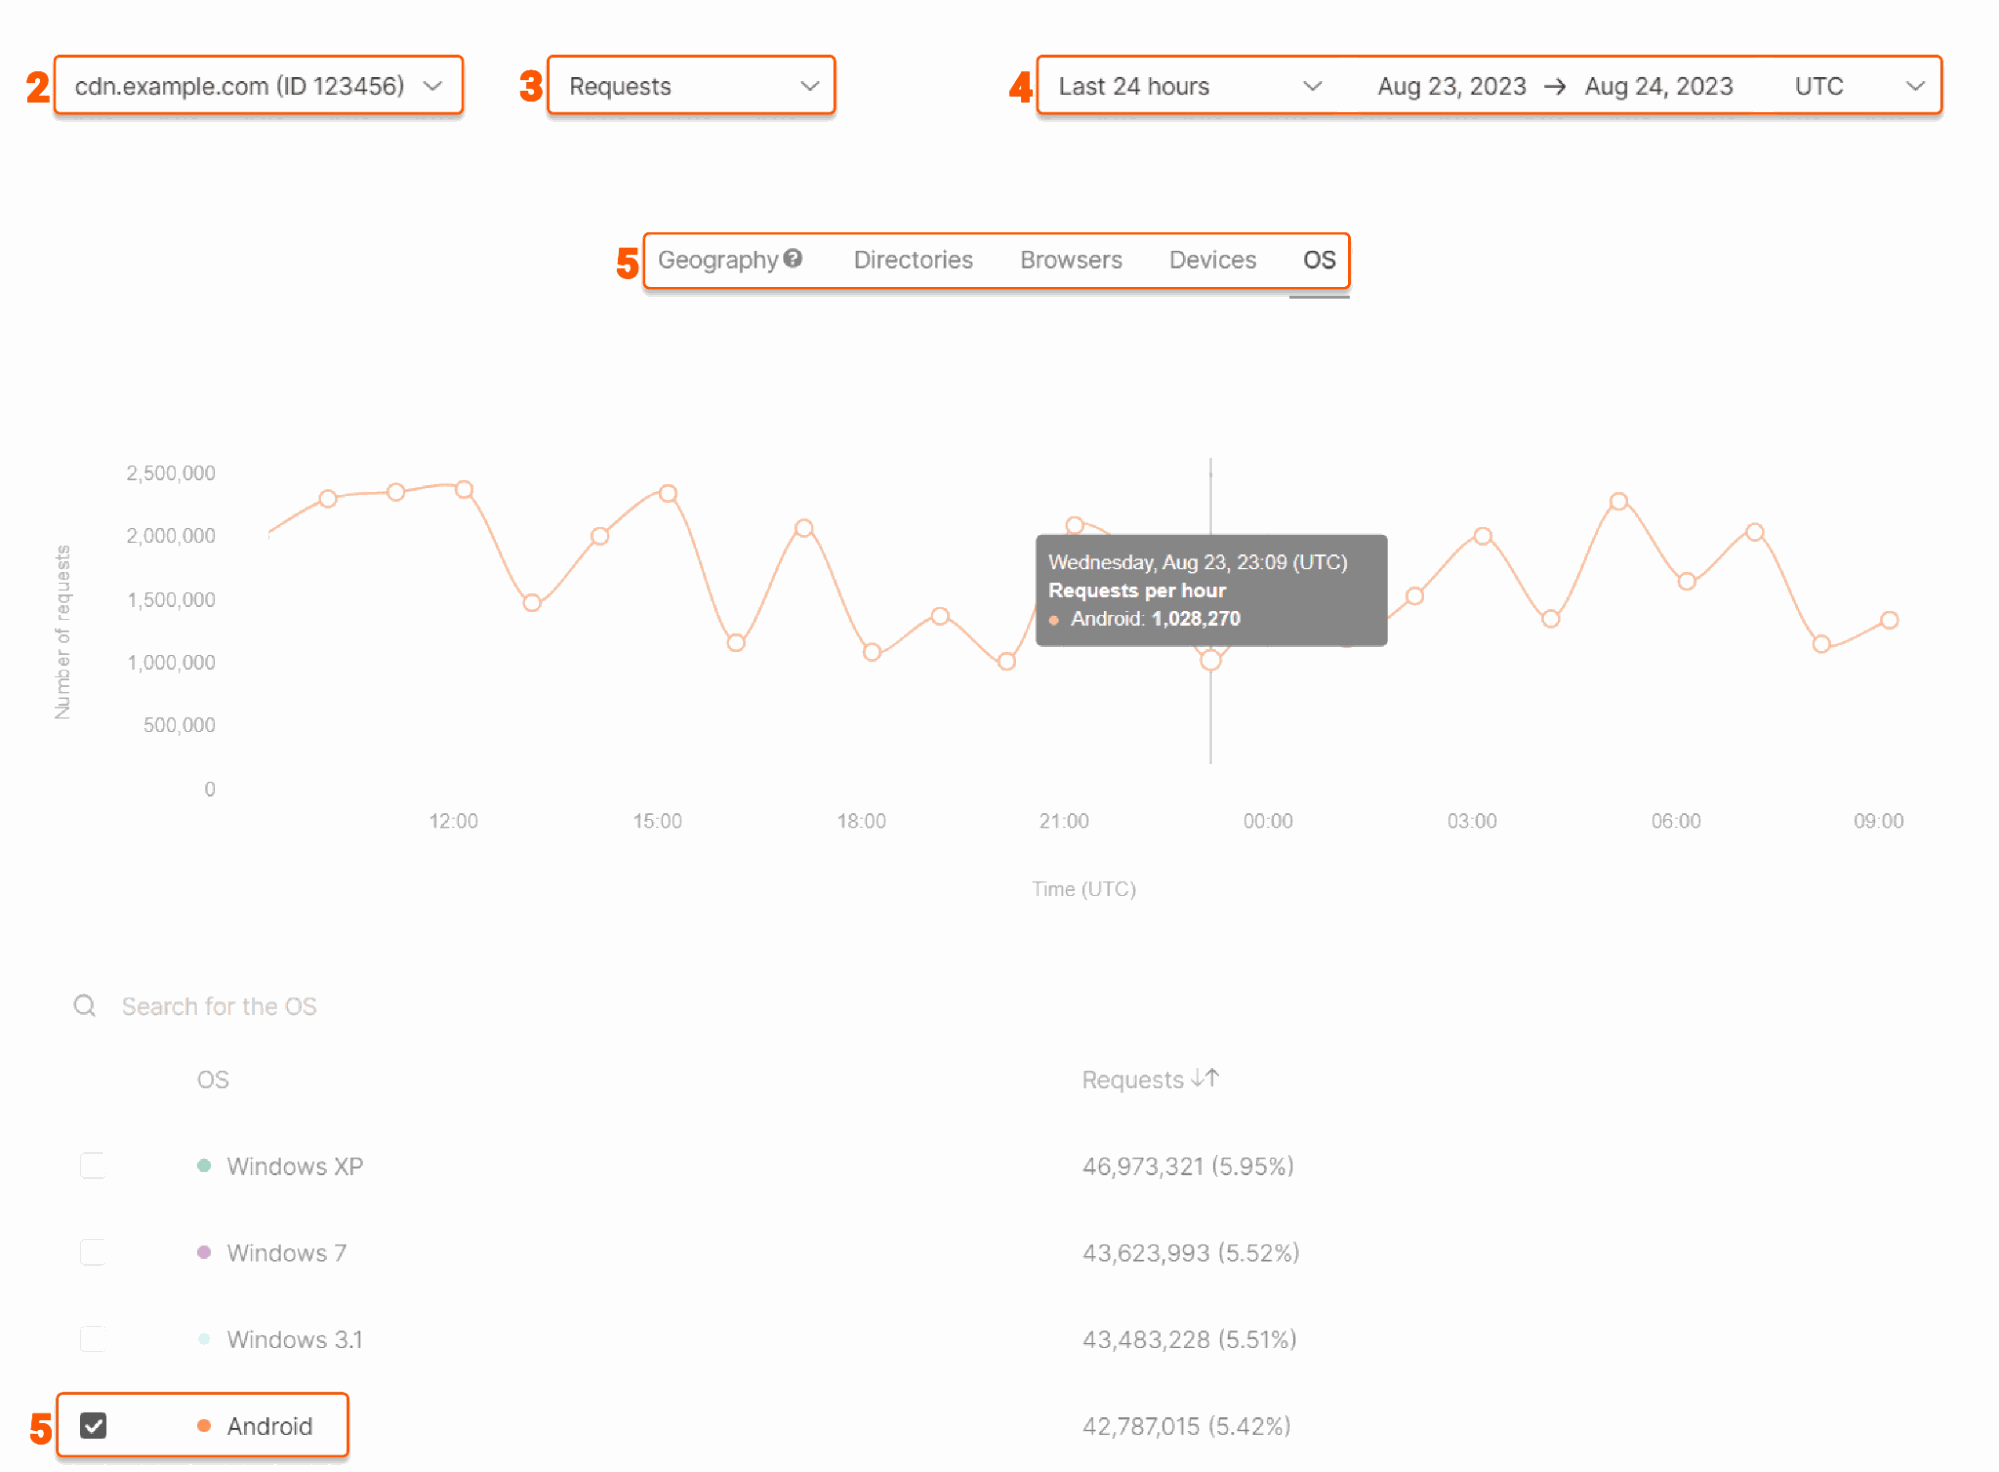
Geography
Geography
The report below contains information collected based on the parameters specified in the filters. For this filter, you can select which countries will be displayed on the chart.For quick navigation, type the countries you want to view into the search bar.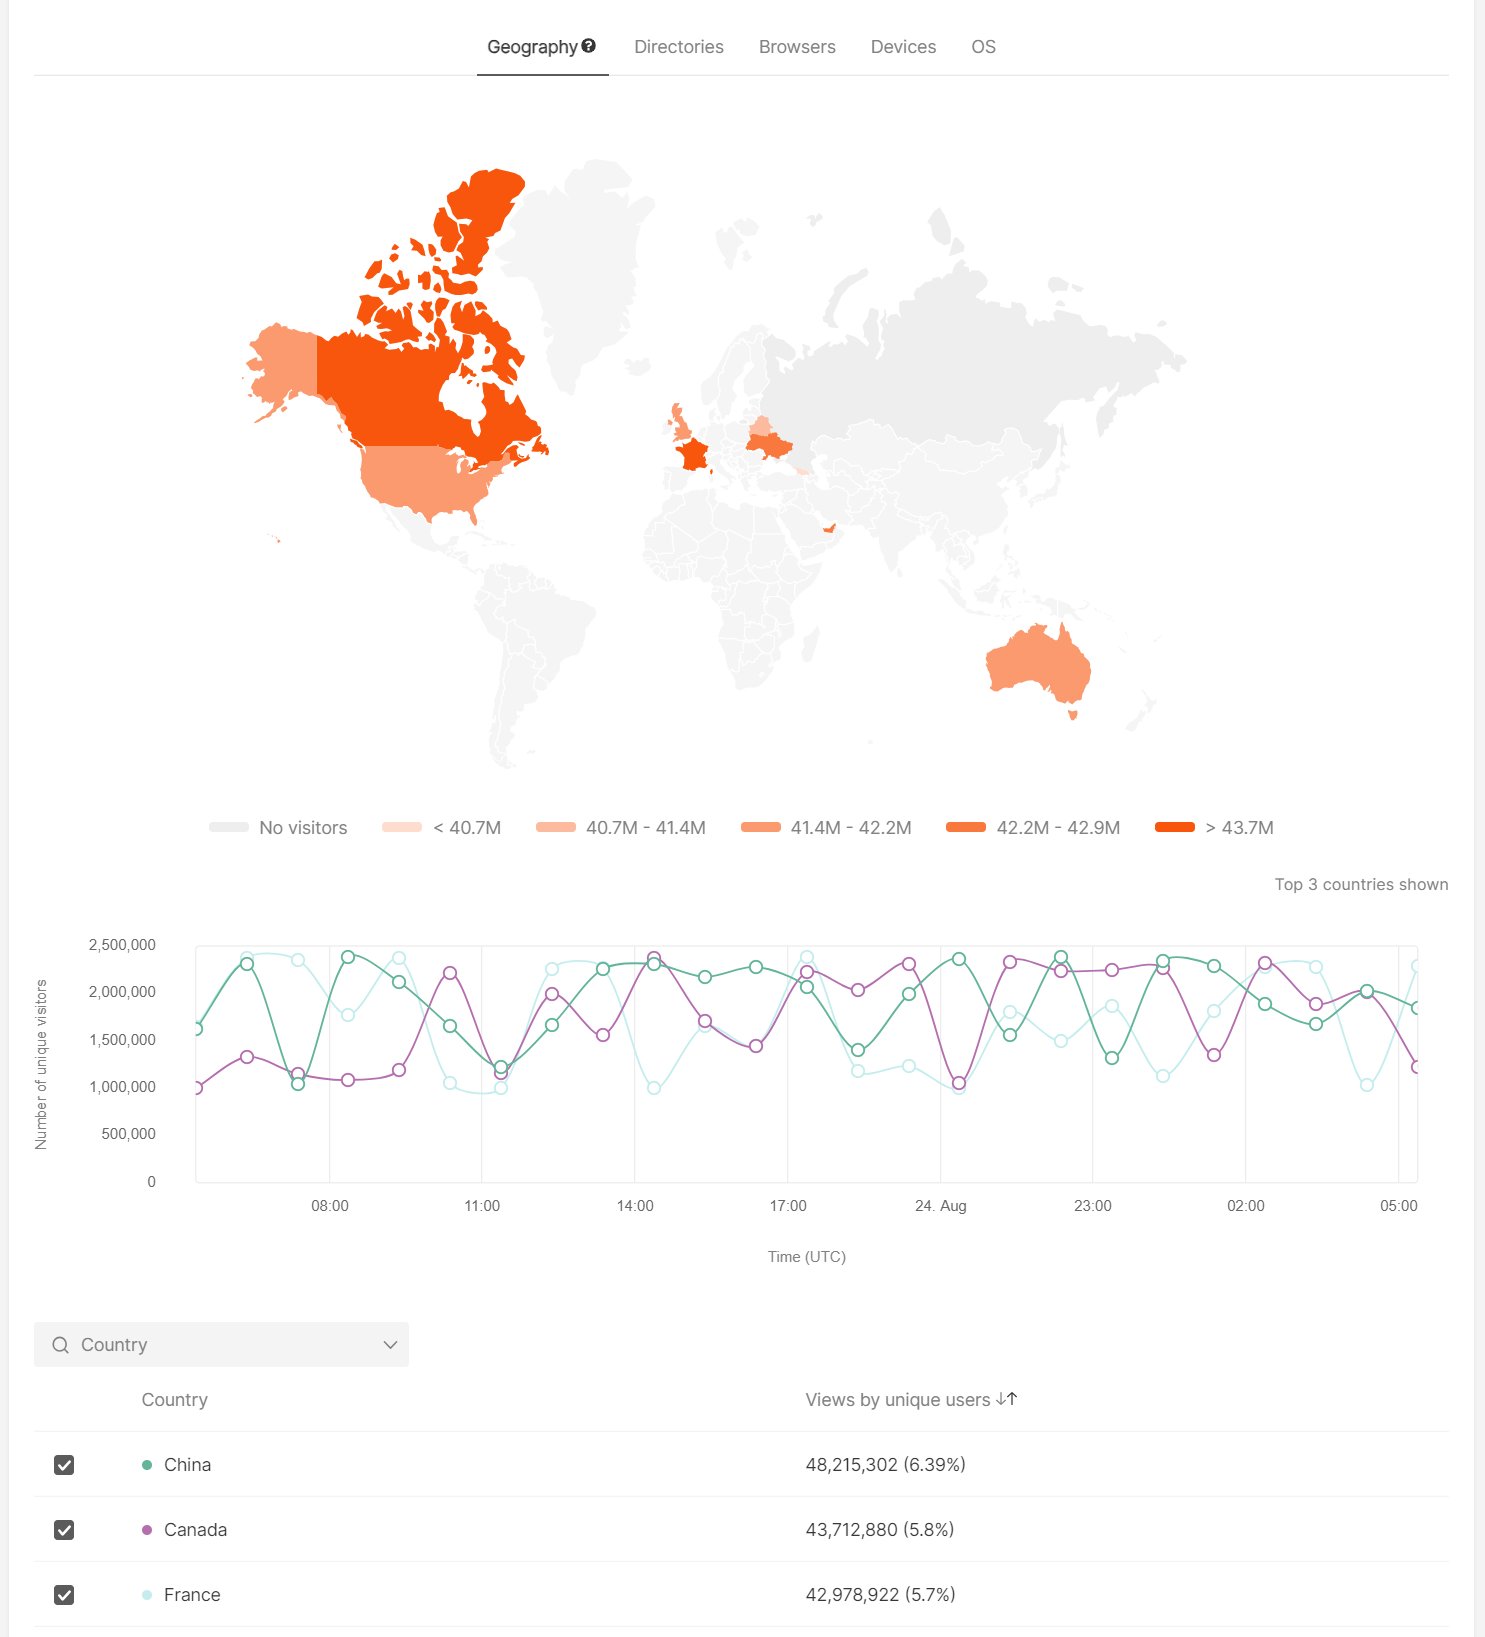
Directories
Directories
The report shows information about directories that users requested. You can select which directories will be displayed on the chart.For quick navigation, type the concrete path you want to view into the search bar.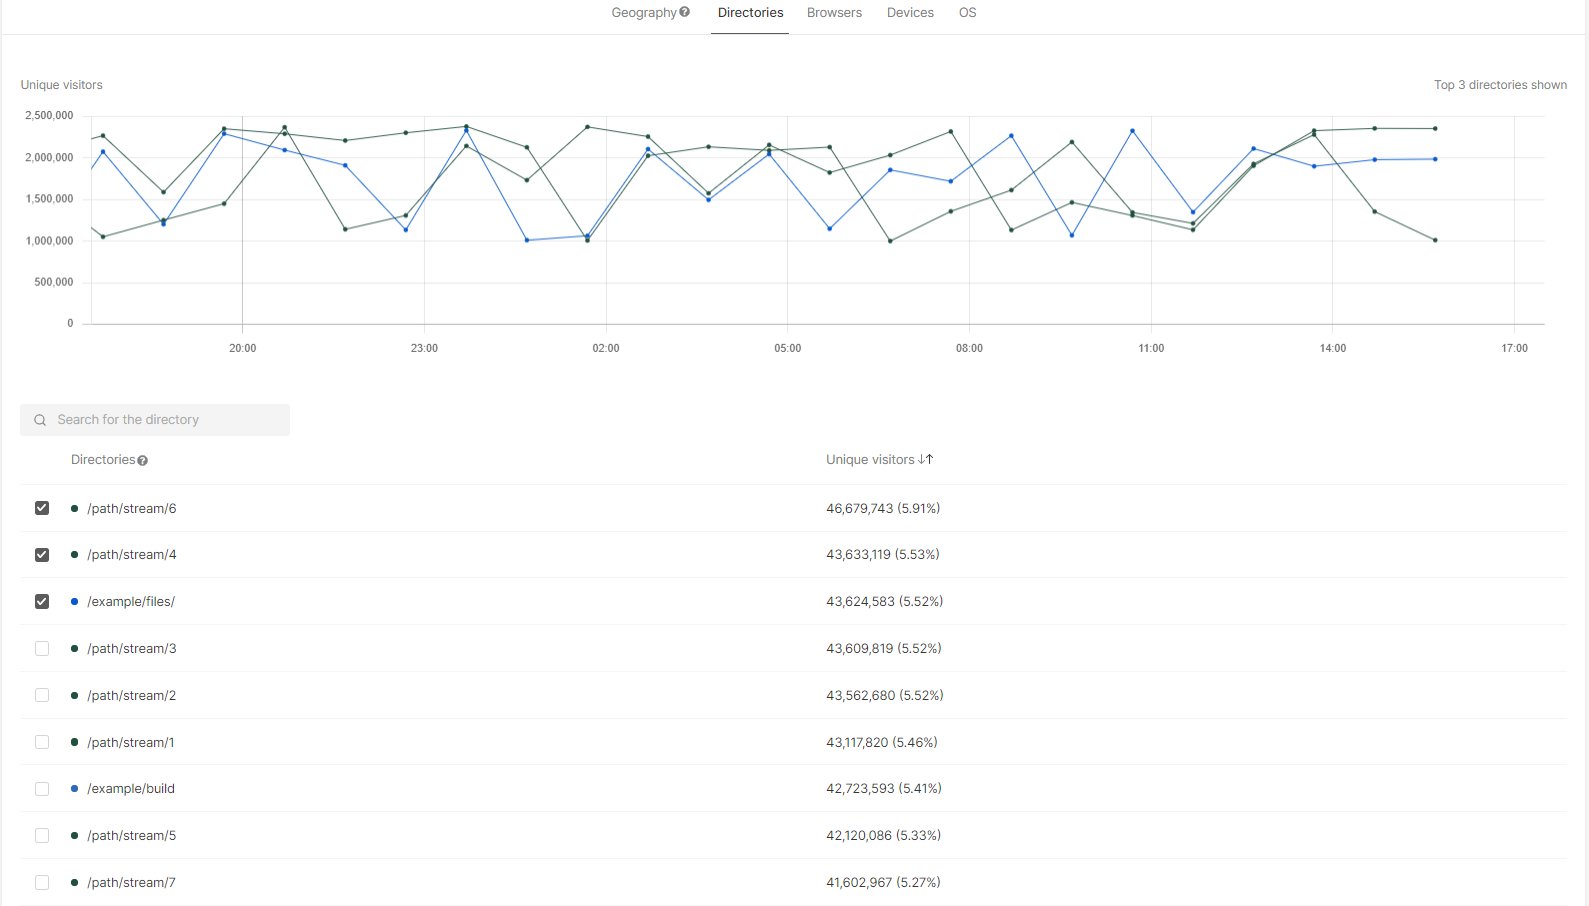
Browsers
Browsers
The report below contains information collected based on the parameters specified in the filters. For this filter, you can choose which browsers will be displayed on the chart.For quick navigation, use the search bar.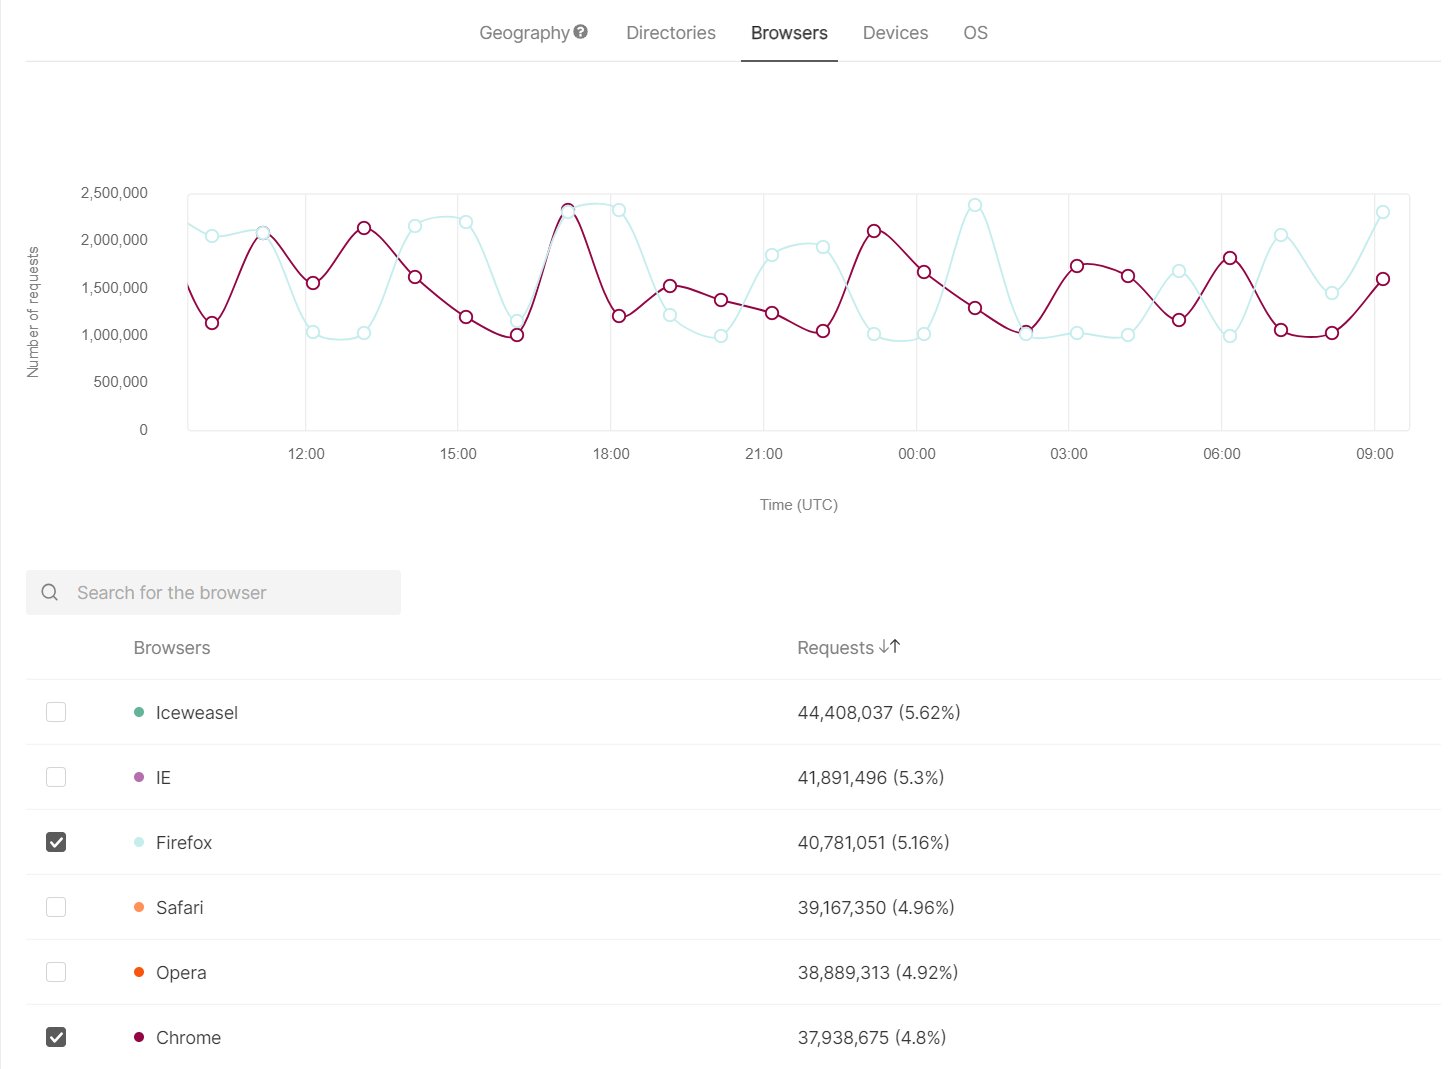
Devices
Devices
The table below contains information collected based on the parameters specified in the filters. For this filter, you can select which devices will be displayed on the chart.For quick navigation, use the search bar.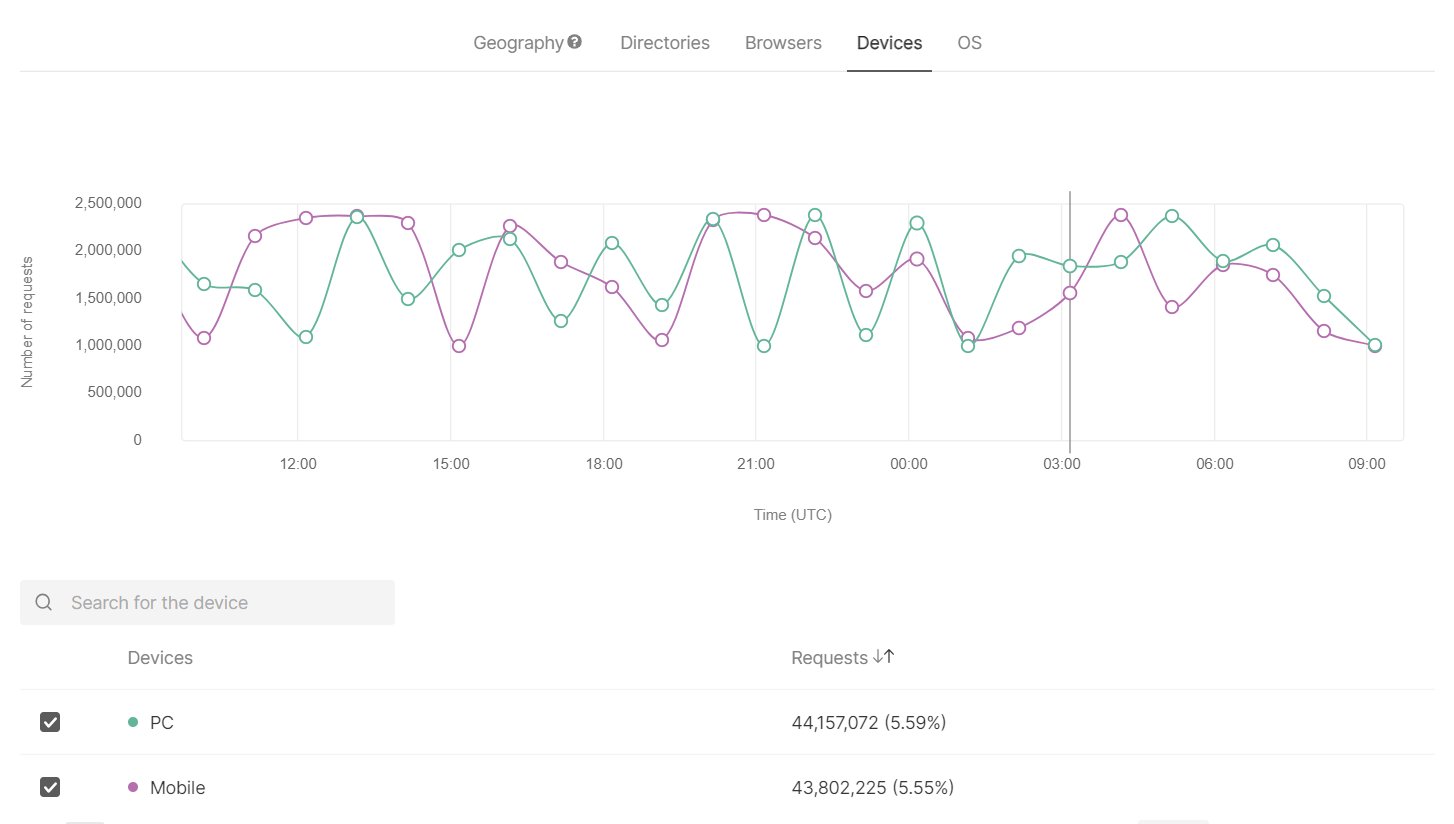
OS
OS
The table below contains information collected based on the parameters specified in the filters. For this filter, you can select which operating systems will be displayed on the chart.For quick navigation, use the search bar.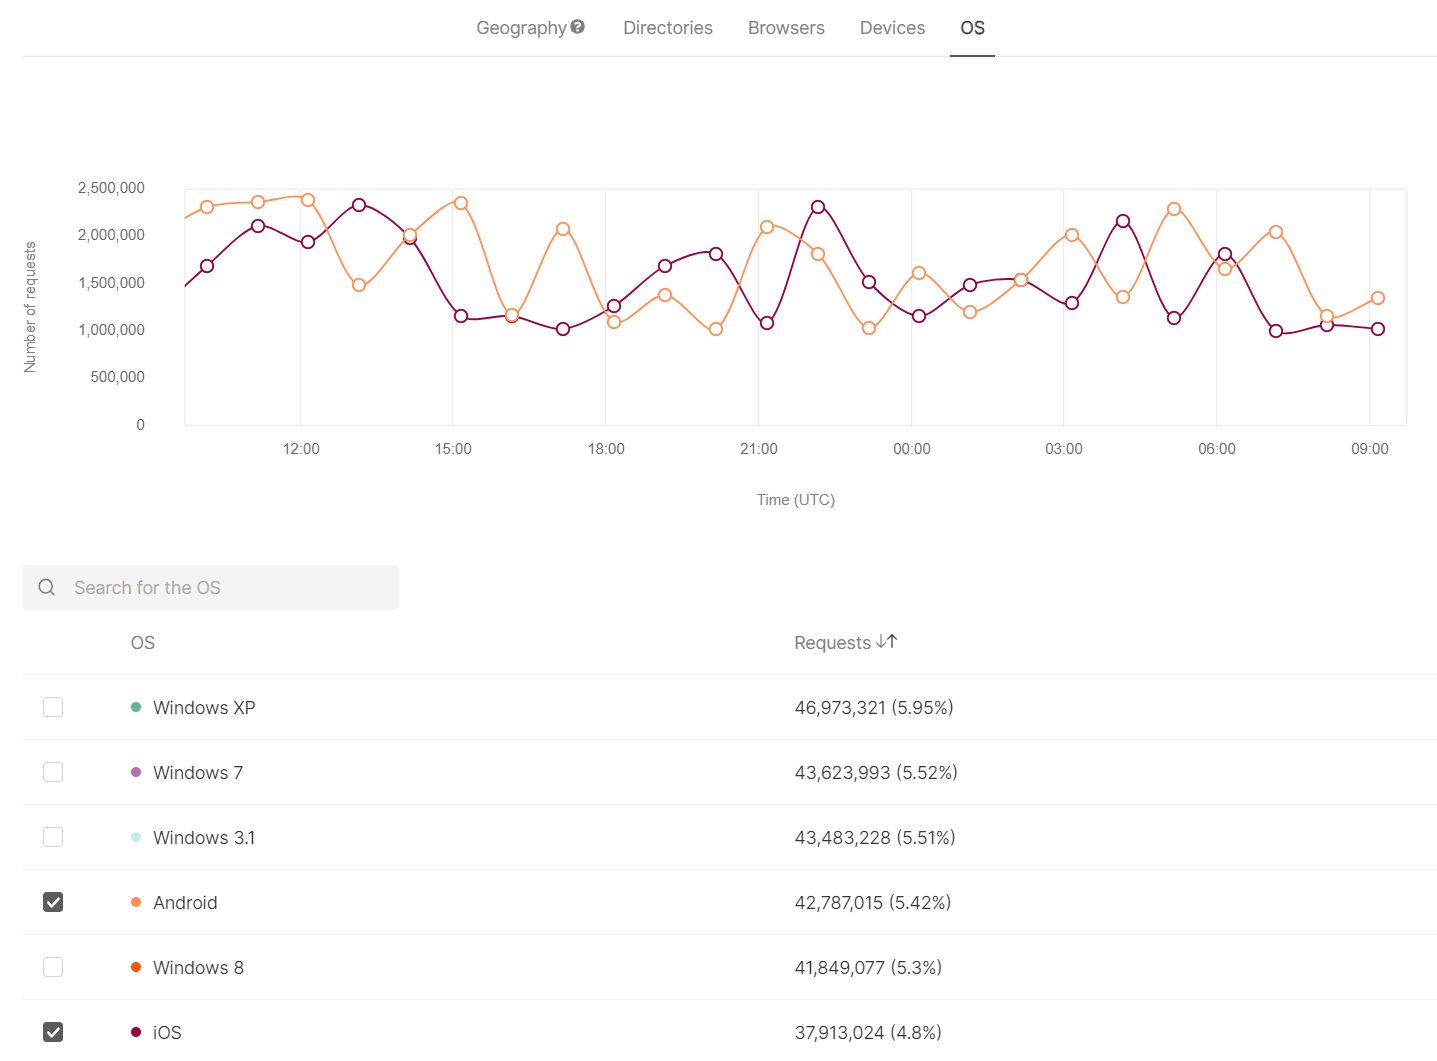
How Advanced Analytics reports are collected
Statistics are used for invoices and displaying data on CDN resources in your personal account. There are two methods for statistics calculation.- For billing statistics and invoices : Accuracy is essential, so we use nginx access logs, which contain a large amount of data. Processing these logs necessitates considerable time and resources, which is why this method isn’t suitable for real-time statistics.
- For reports in your personal account : Speed is important, so we use nginx virtual host traffic status module, which contains information about the current status of resources. We use this method to create and display reports in your personal account.
NoteUTC time zone is used for all statistics.