WAAP events page provides comprehensive information about incoming traffic to your domain. It features detailed statistics about recent requests, potential threats, and frequently triggered rules, allowing you to fine-tune your WAAP settings based on the analyzed data.
InfoAfter you enable WAAP protection for your CDN resource, it might take up to 20 minutes to populate your domain with real data and apply all system-wide settings.
-
Overview: Get a consolidated view of all incoming requests that have been inspected by WAAP.
-
Events: View detailed statistics on the incoming requests and the actions enforced for those requests.
-
L7 DDoS: Check for recent attacks and get detailed information about each of them.
To access analytics for your domain:
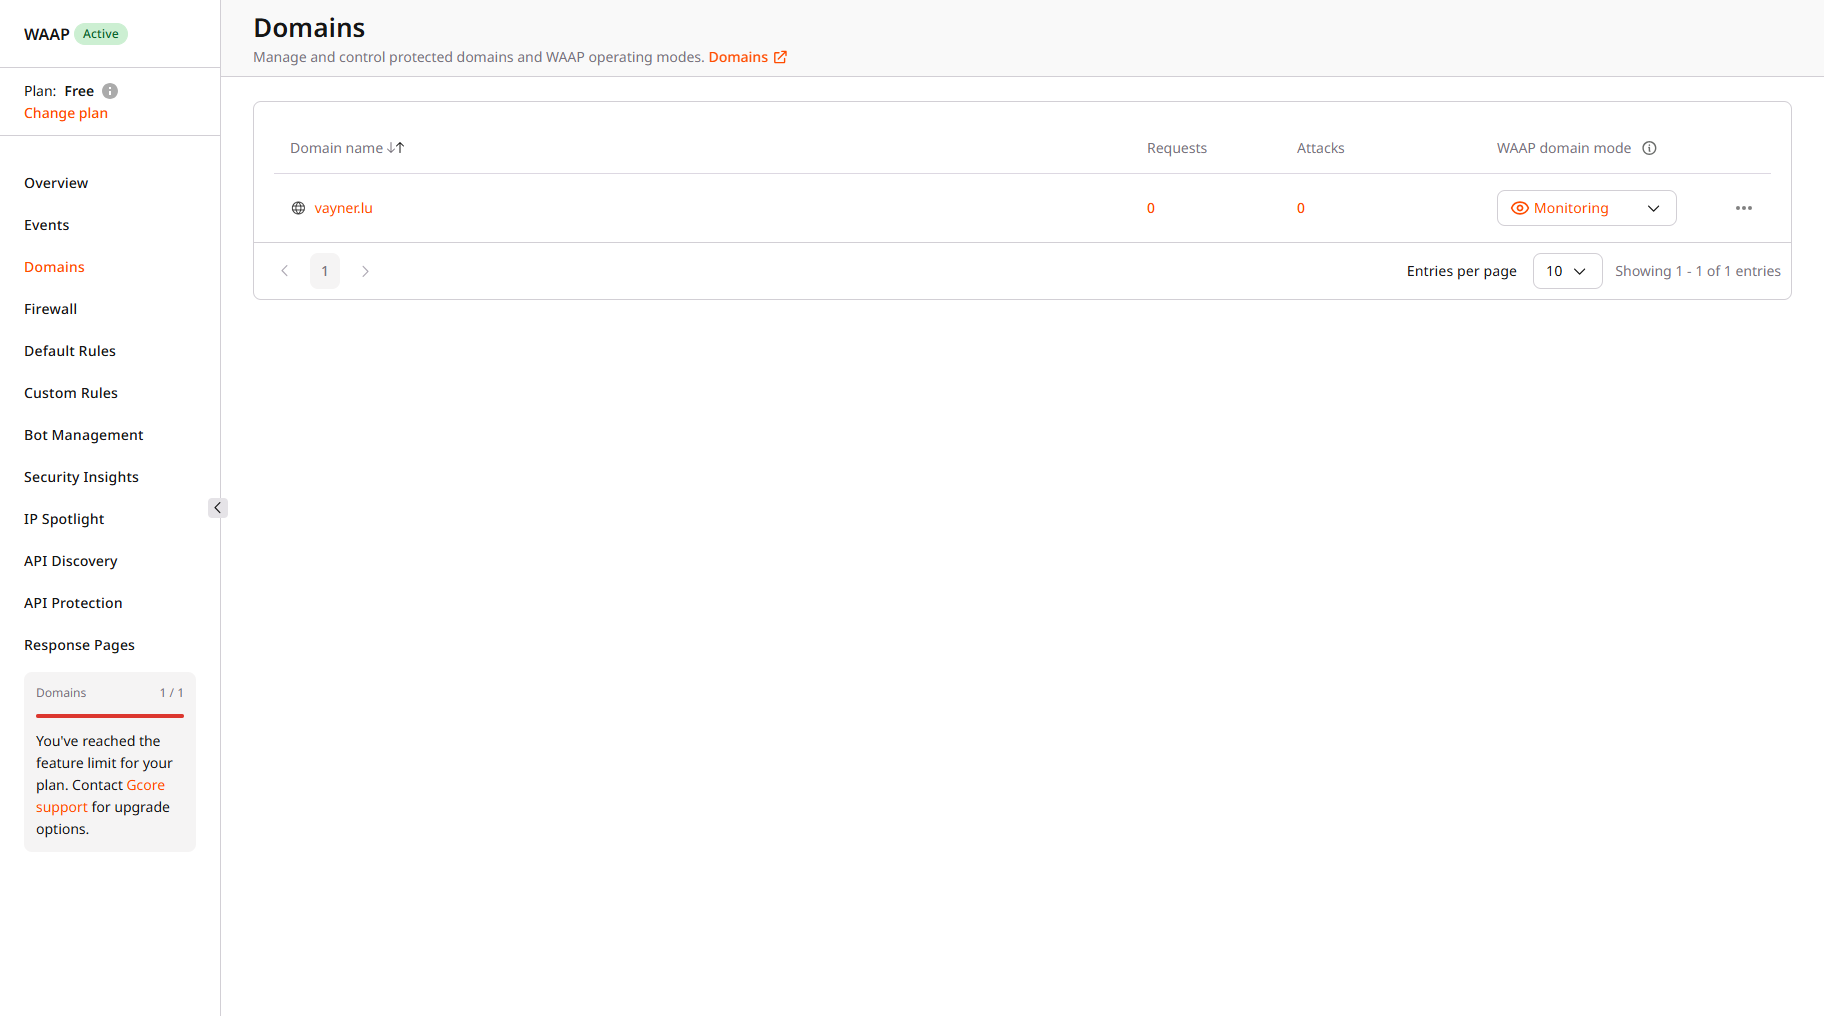
1. In the Gcore Customer Portal, navigate to WAAP > Domains.
2. Find the domain where you want to check analytics and click the domain name to open it. You’ll be directed to the Overview page.
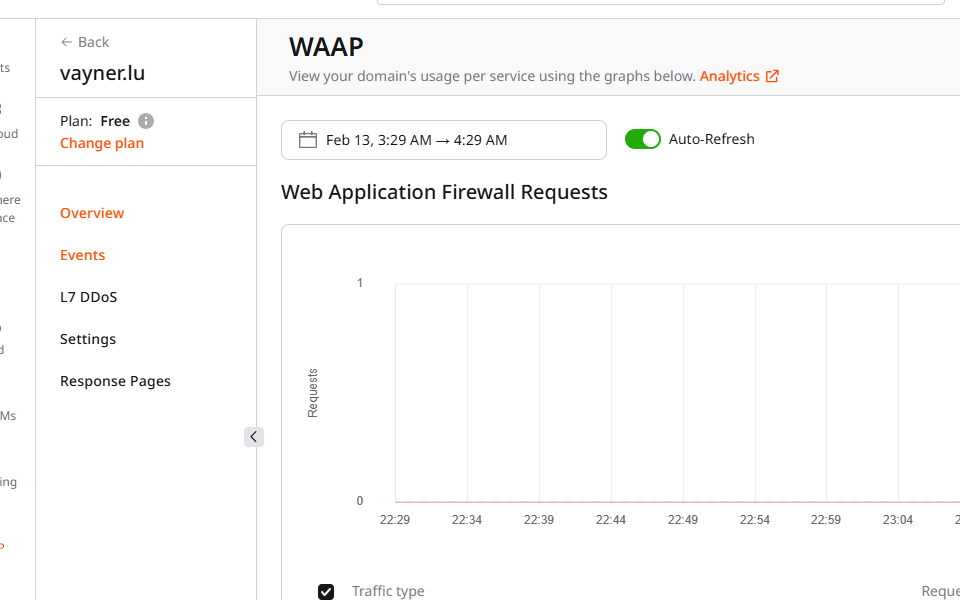
3. In the sidebar, click Events.
TipIf you want to view analytics for a different domain, use the dropdown in the top-right corner of the screen and select the needed domain.
Overview page
This page features general information about incoming requests and contains two graphs: WAAP and Status codes.
WAAP
This graph shows the number of inspected requests for the selected period and the number of requests that have been blocked.
Events page
This page features detailed statistics on HTTP requests and displays data in the graph format (Web Application Firewall Requests) and as a table (Requests).
Web application firewall requests
This graph shows information about actions that were applied to incoming requests. The data is displayed in a plot chart format that gives a comprehensive overview of both good and bad requests—potential security threats detected based on a triggered rule.
You can select the following filters to view specific types of requests:
-
Monitored Requests: View requests that were triggered by the monitor reserved tag.
-
Policy - Blocked: View requests that were blocked because of a triggered default policy.
-
Custom Rule - Blocked: View requests that were blocked because of a triggered custom rule created in your account.
-
DDoS L7 - Blocked: View requests that were blocked because of a triggered default rule related to DDoS. To learn more about how requests can trigger this rule, refer to our L7 DDoS protection guide.
-
Passed to Origin: View requests that successfully reached the origin.
Any changes made to the WAAP requests plot are also displayed in the Requests table below the plot:
-
When you click on a particular data point on the plot, the Requests table is filtered accordingly. The date, time, and the corresponding traffic type are updated to show information relevant to what you’ve selected on the plot.
-
When you select a specific filter like Policy - Blocked, the Requests table is filtered to display only information that matches the same filter.
TipUpdating filters on the table doesn’t change the data displayed on the Web Application Firewall Requests graph.
Requests table
This table displays incoming requests for the past 24 hours, including good and bad ones (potential threats). Request history is retained for 30 days.
You can select multiple filters to get a more granular view of the displayed information in the table.
| Table column | Description |
|---|
| Request ID | A unique identifier assigned to each HTTP request. Click the ID to open the Request Details page, which provides comprehensive information about the request. |
| Date | The date and time when a rule was triggered or a request occurred. |
| IP | The origin IP address of the client. |
| Country | The origin location of the IP. |
| Response Code | HTTP code returned in response to the request. |
| Security Rule Triggered | The default or custom rule name that was triggered by the request. You can click on the rule name to view detailed information about the rule and the triggered request. |
| Security Action | The action that was taken against the request:
- Allow: Display requests that were allowed to pass.
- Block: Display requests that were blocked.
- CAPTCHA: Display requests that got the Captcha validation screen, regardless of whether the request passed or failed the validation.
- Handshake (JavaScript validation): Display requests that were presented with a JavaScript validation screen, regardless of whether the request passed or failed the screen.
|
| Result | The result of the request based on the enforced action. For example, if a request was presented with a Captcha, and the request didn’t pass, then the result is “Blocked”. |
| Create rule | A button that you can select to create a rule for the IP address. |
| Threats (last 24 hours) | This section displays the most triggered actions and default policies, along with how many times each of them was triggered. |
-
Inspect request details
-
Create a new rule for the IP address that will challenge requests with JavaScript or CAPTCHA validation or add it to the block or allow list.
Request details
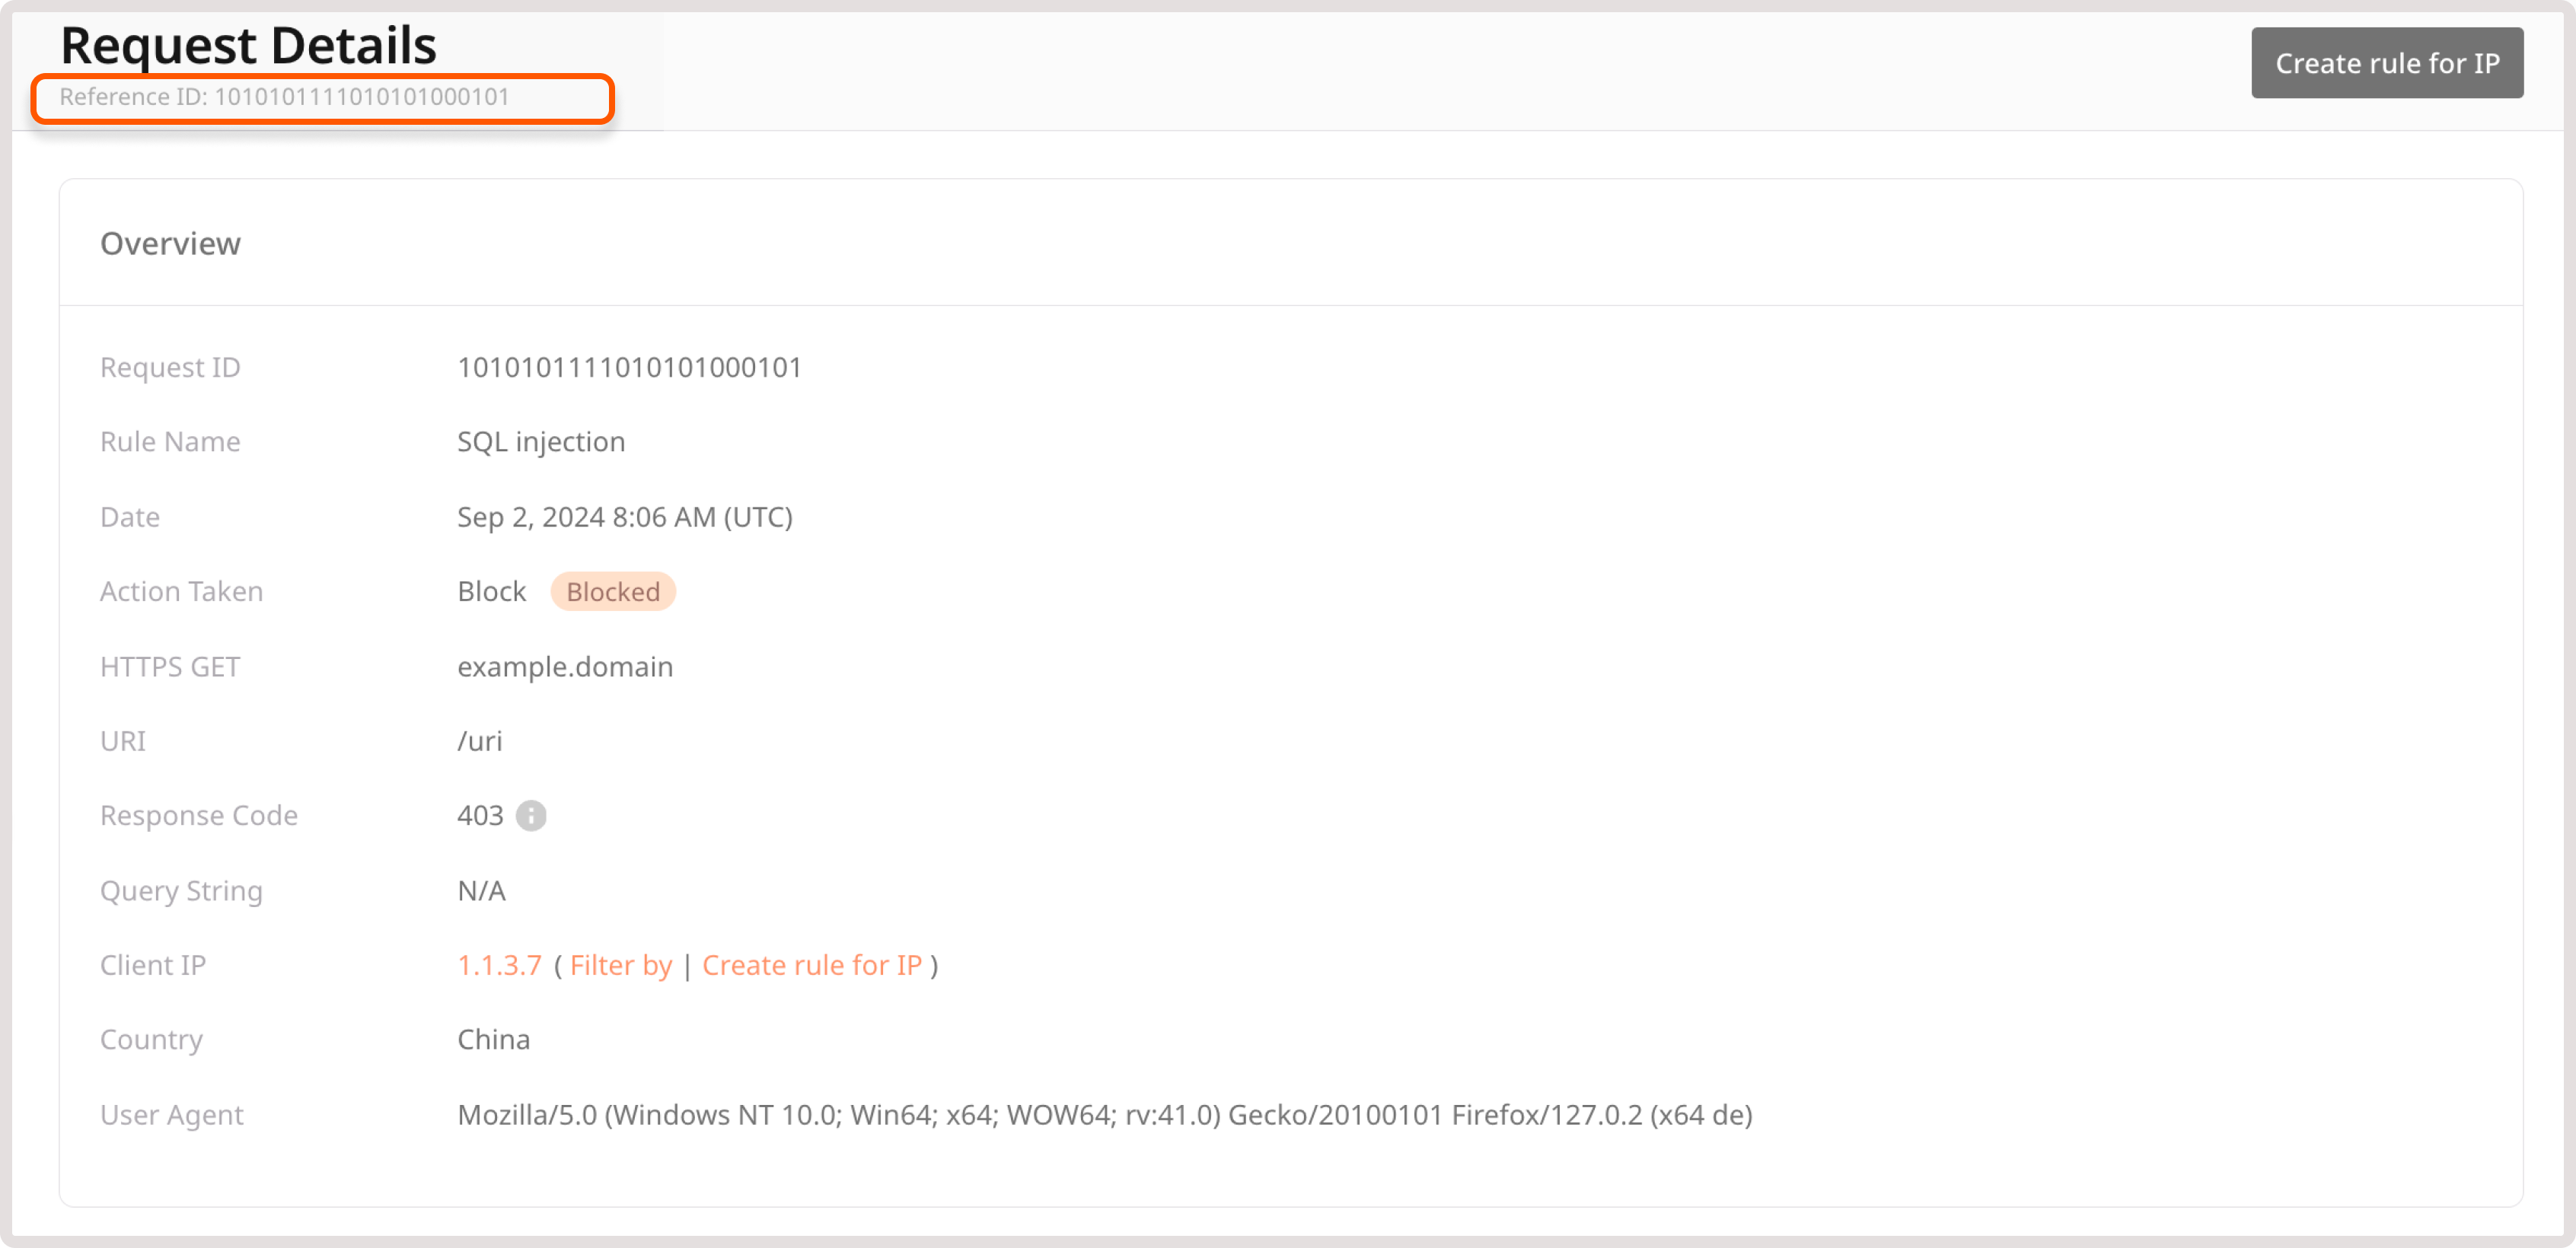
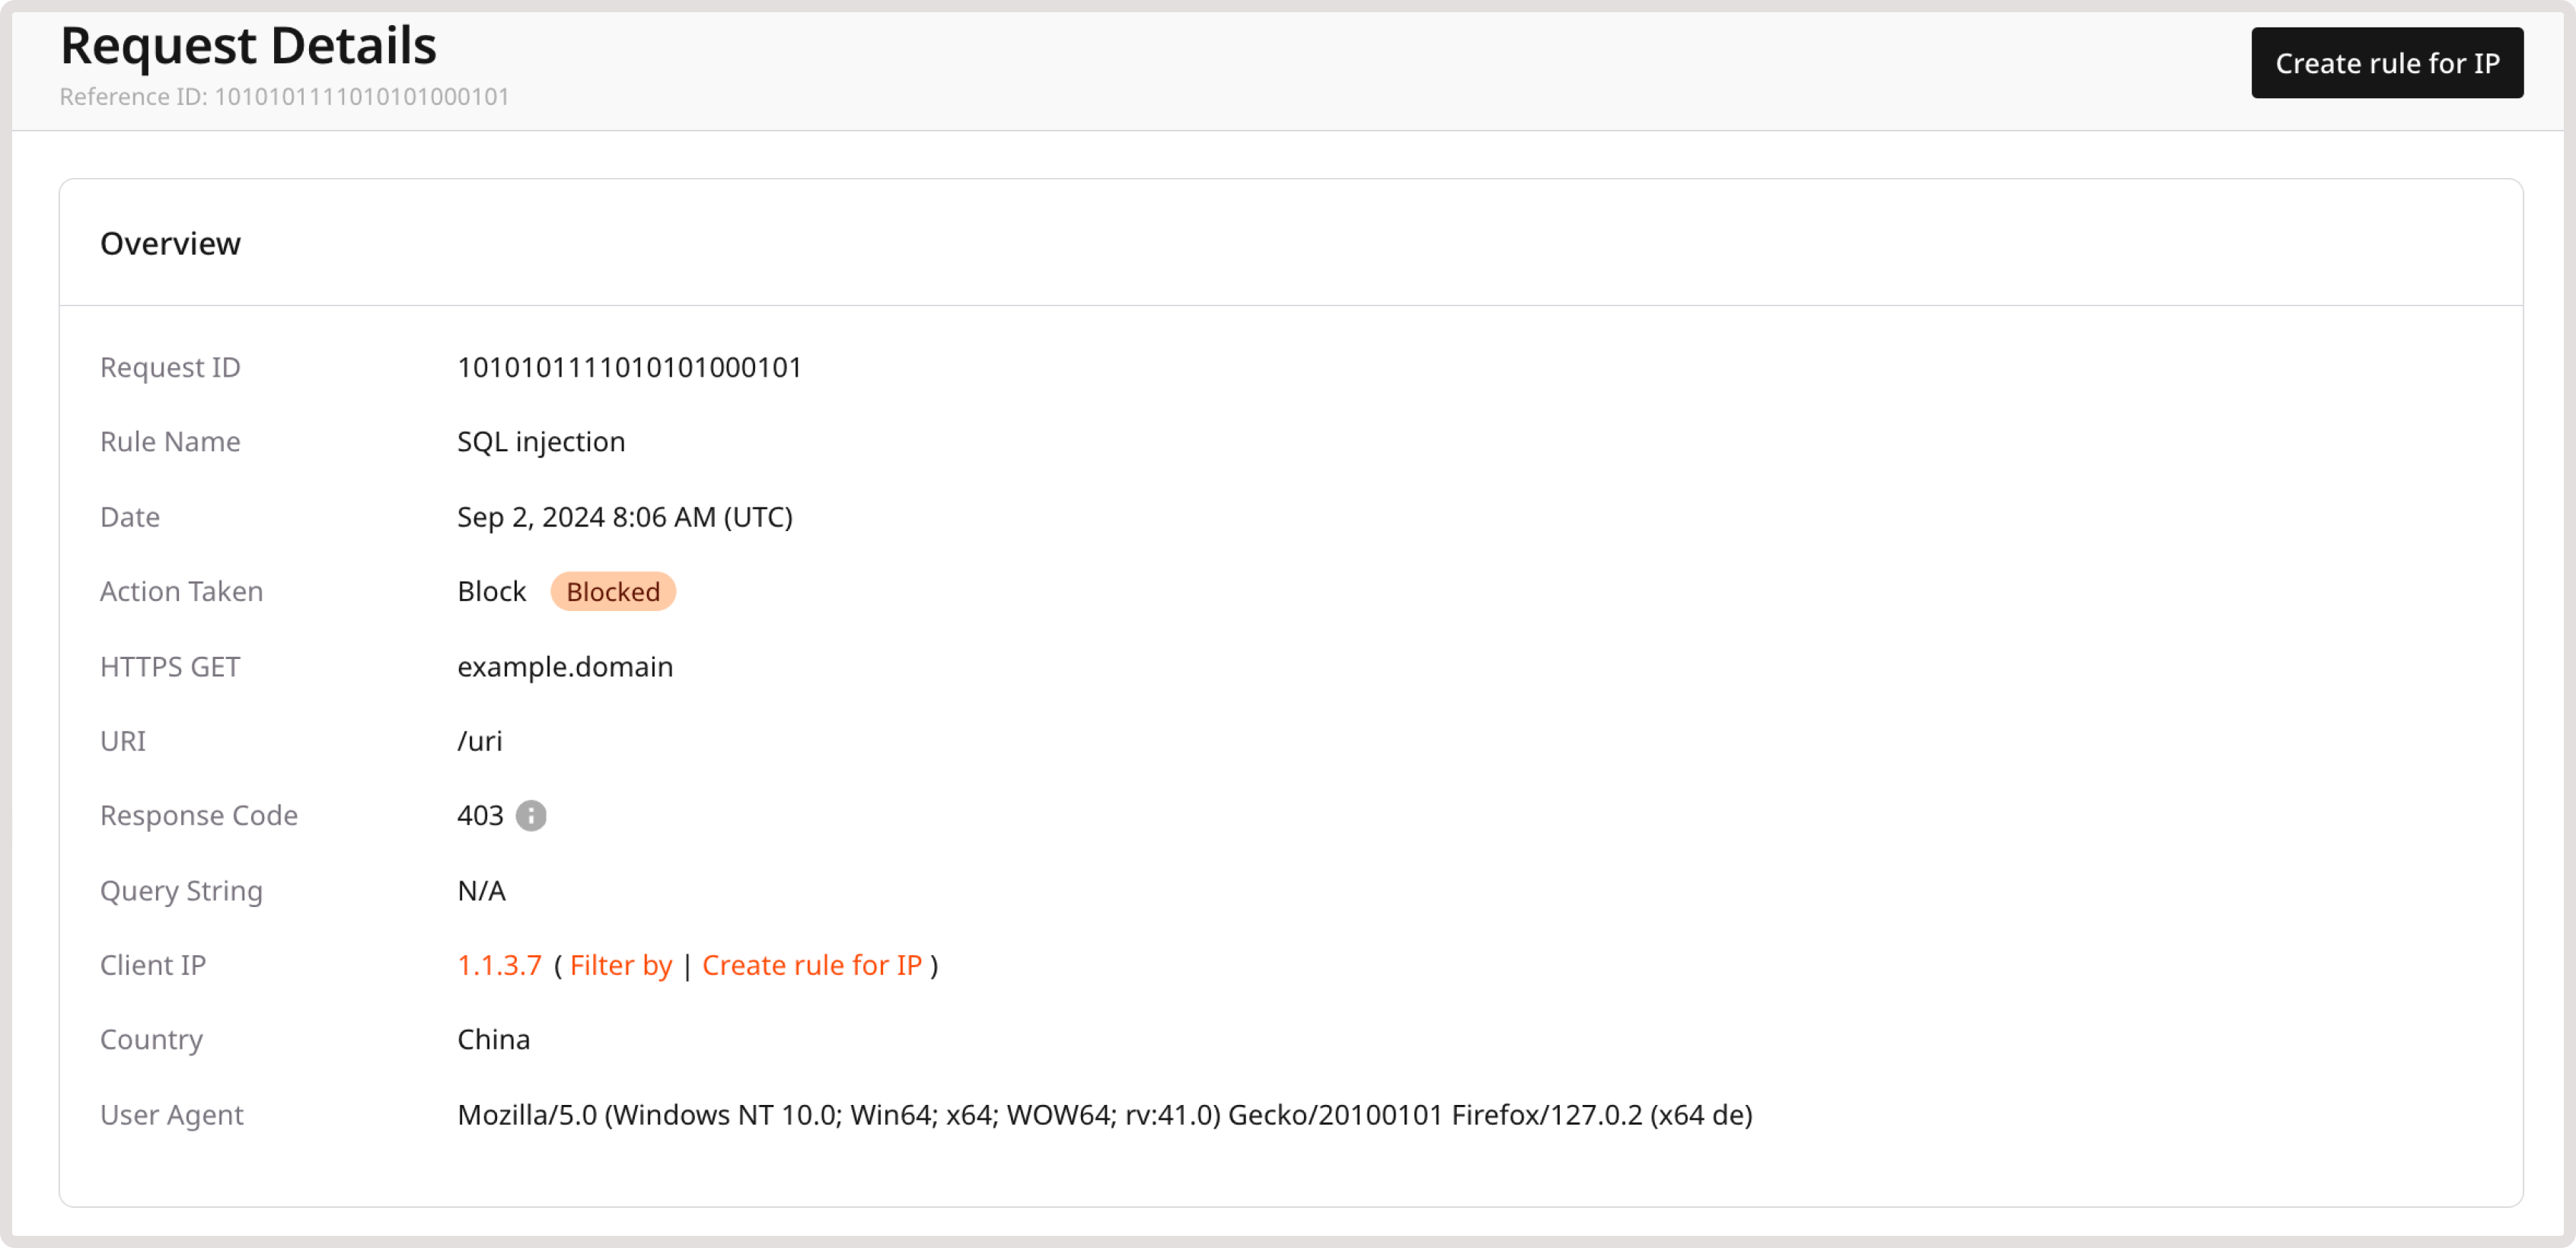
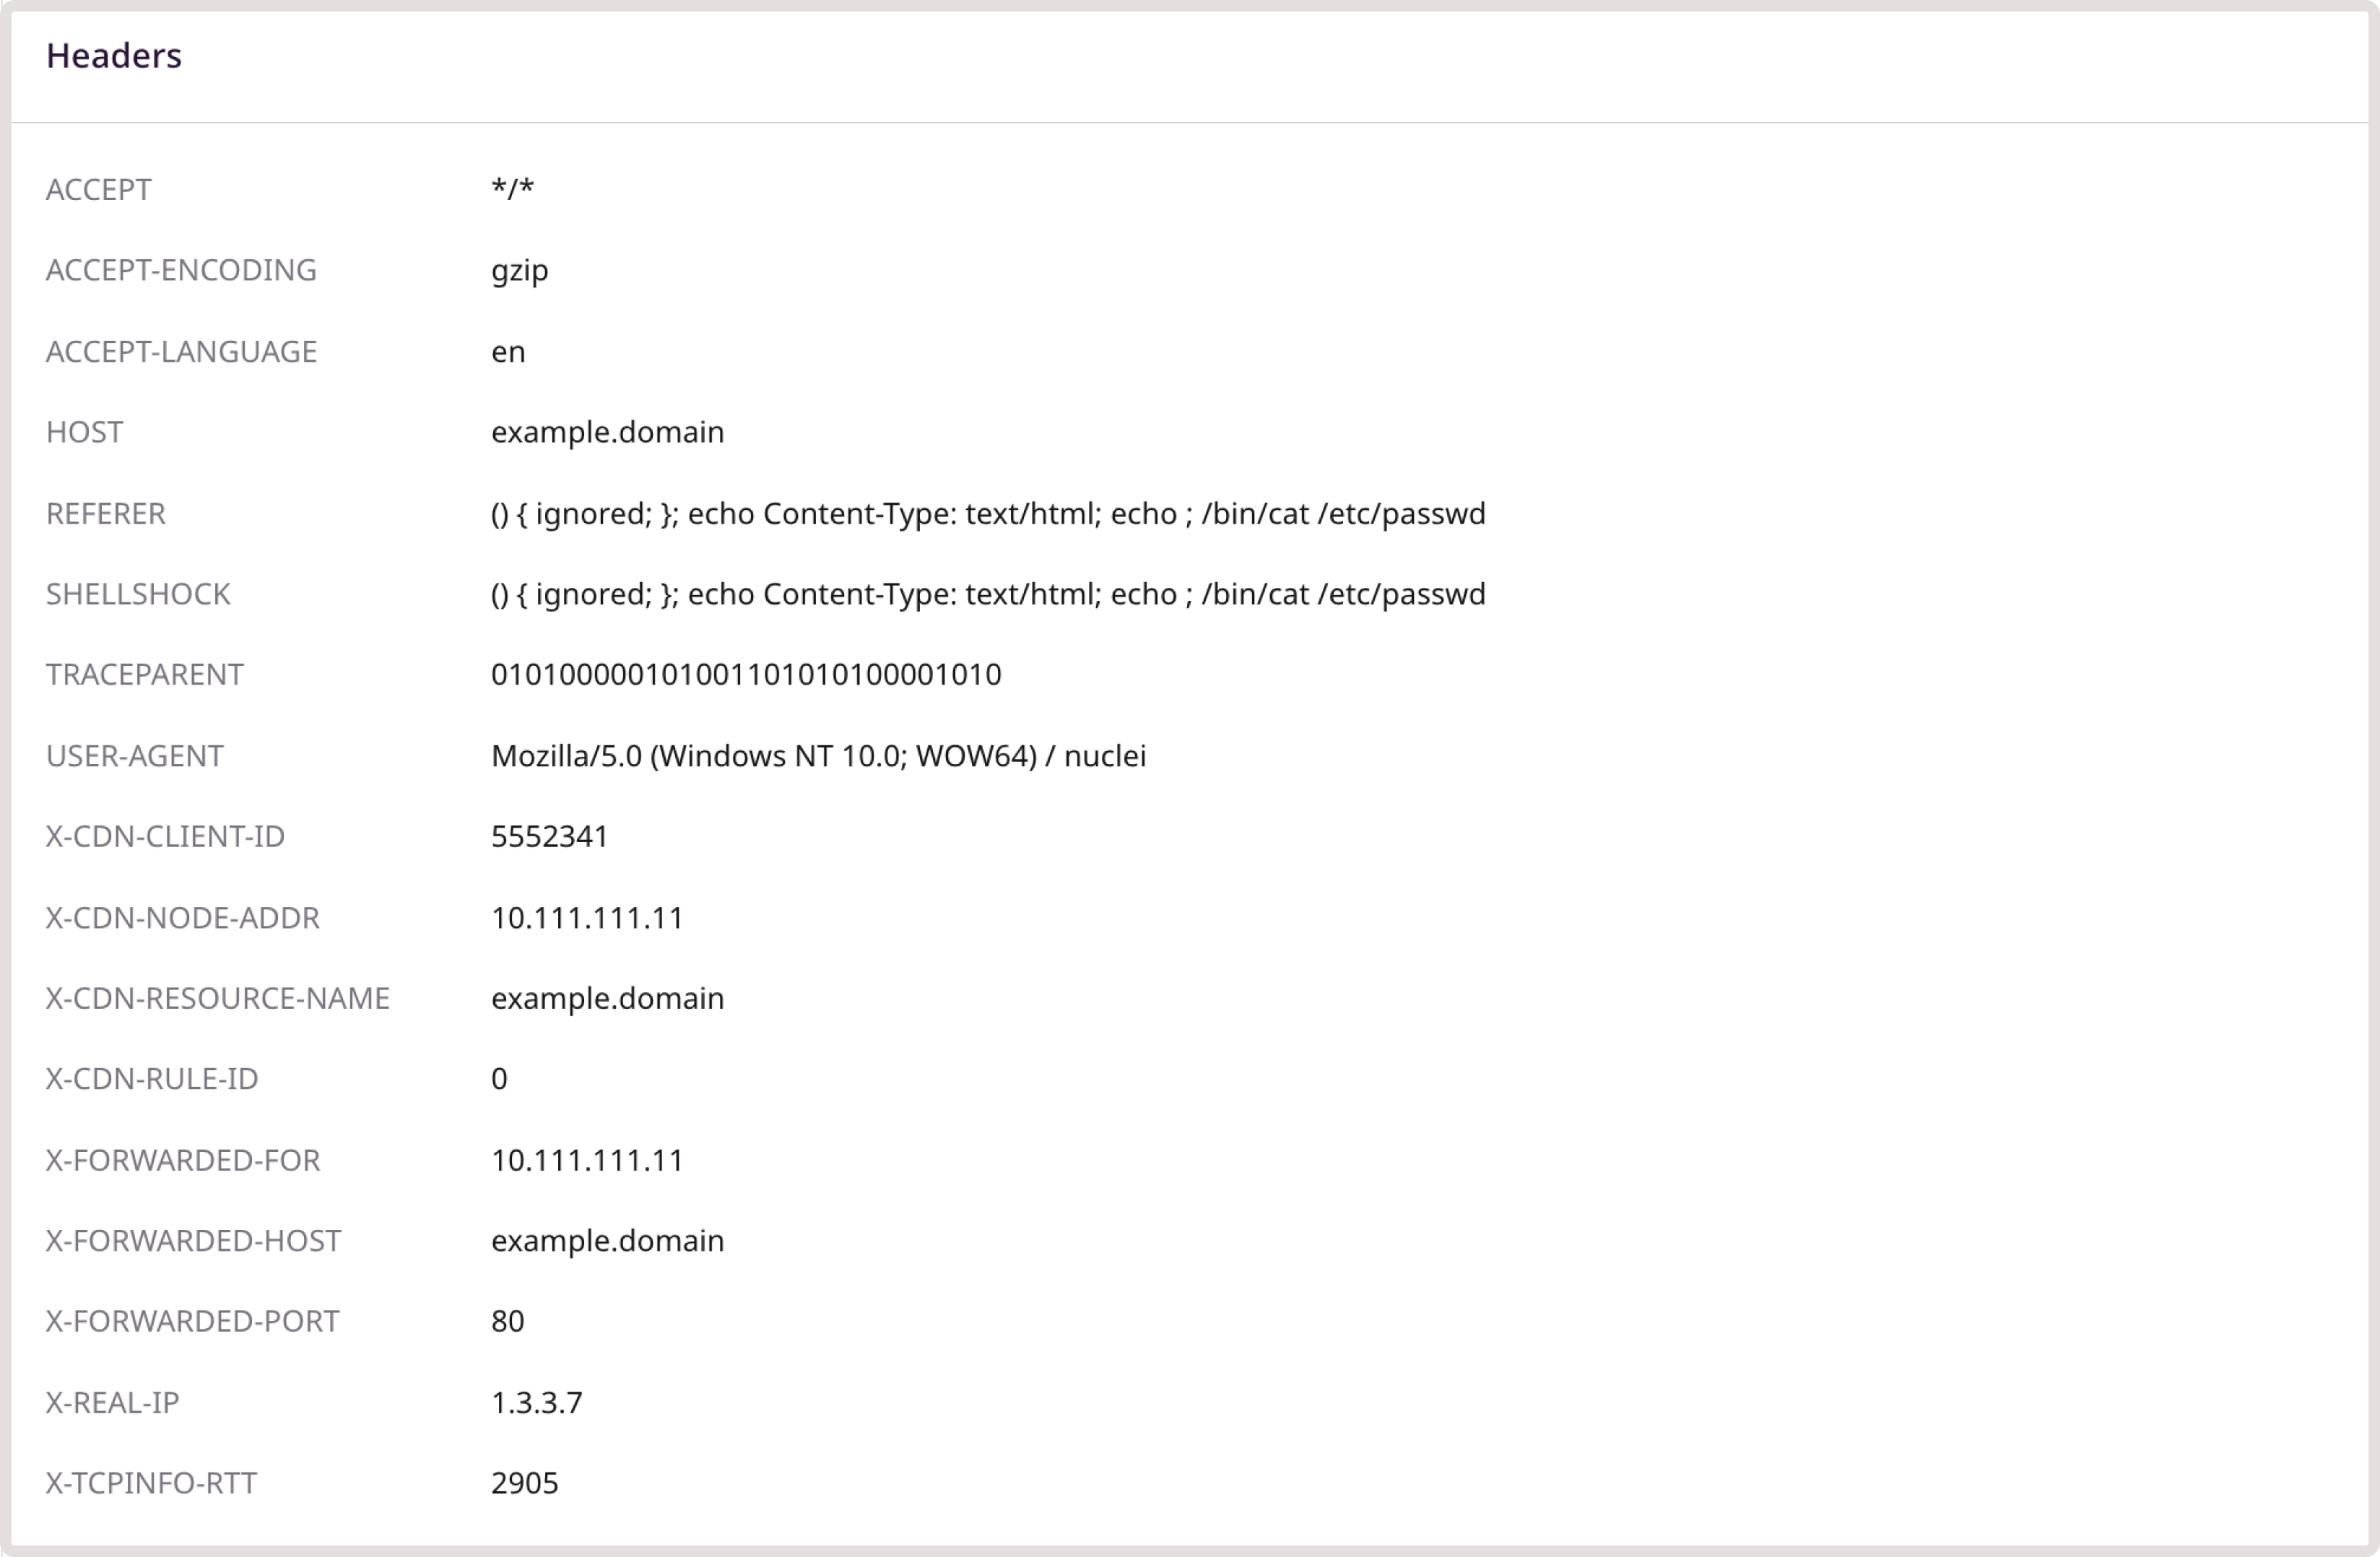
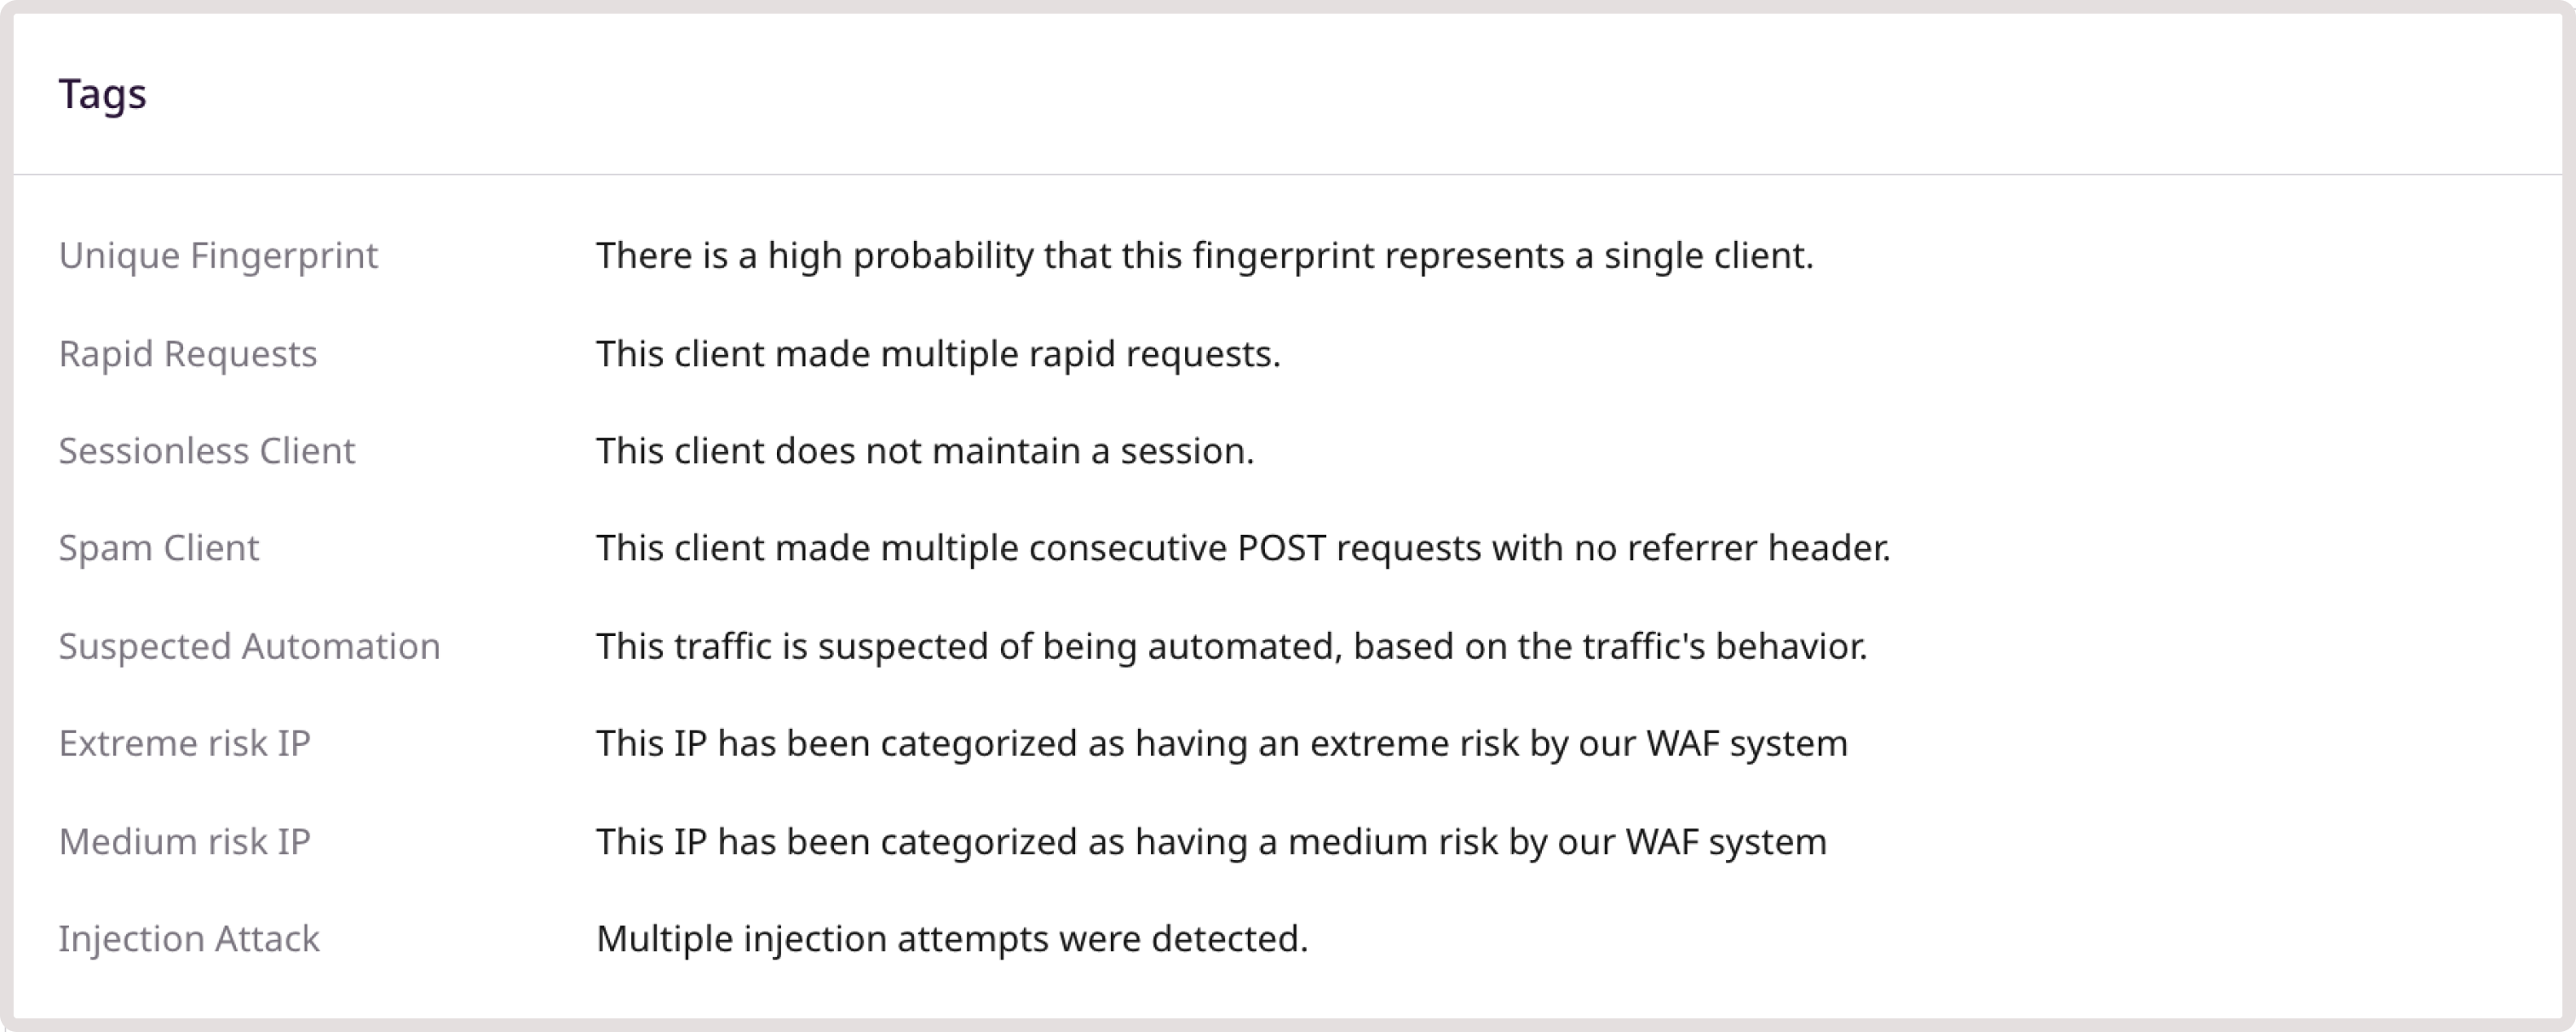
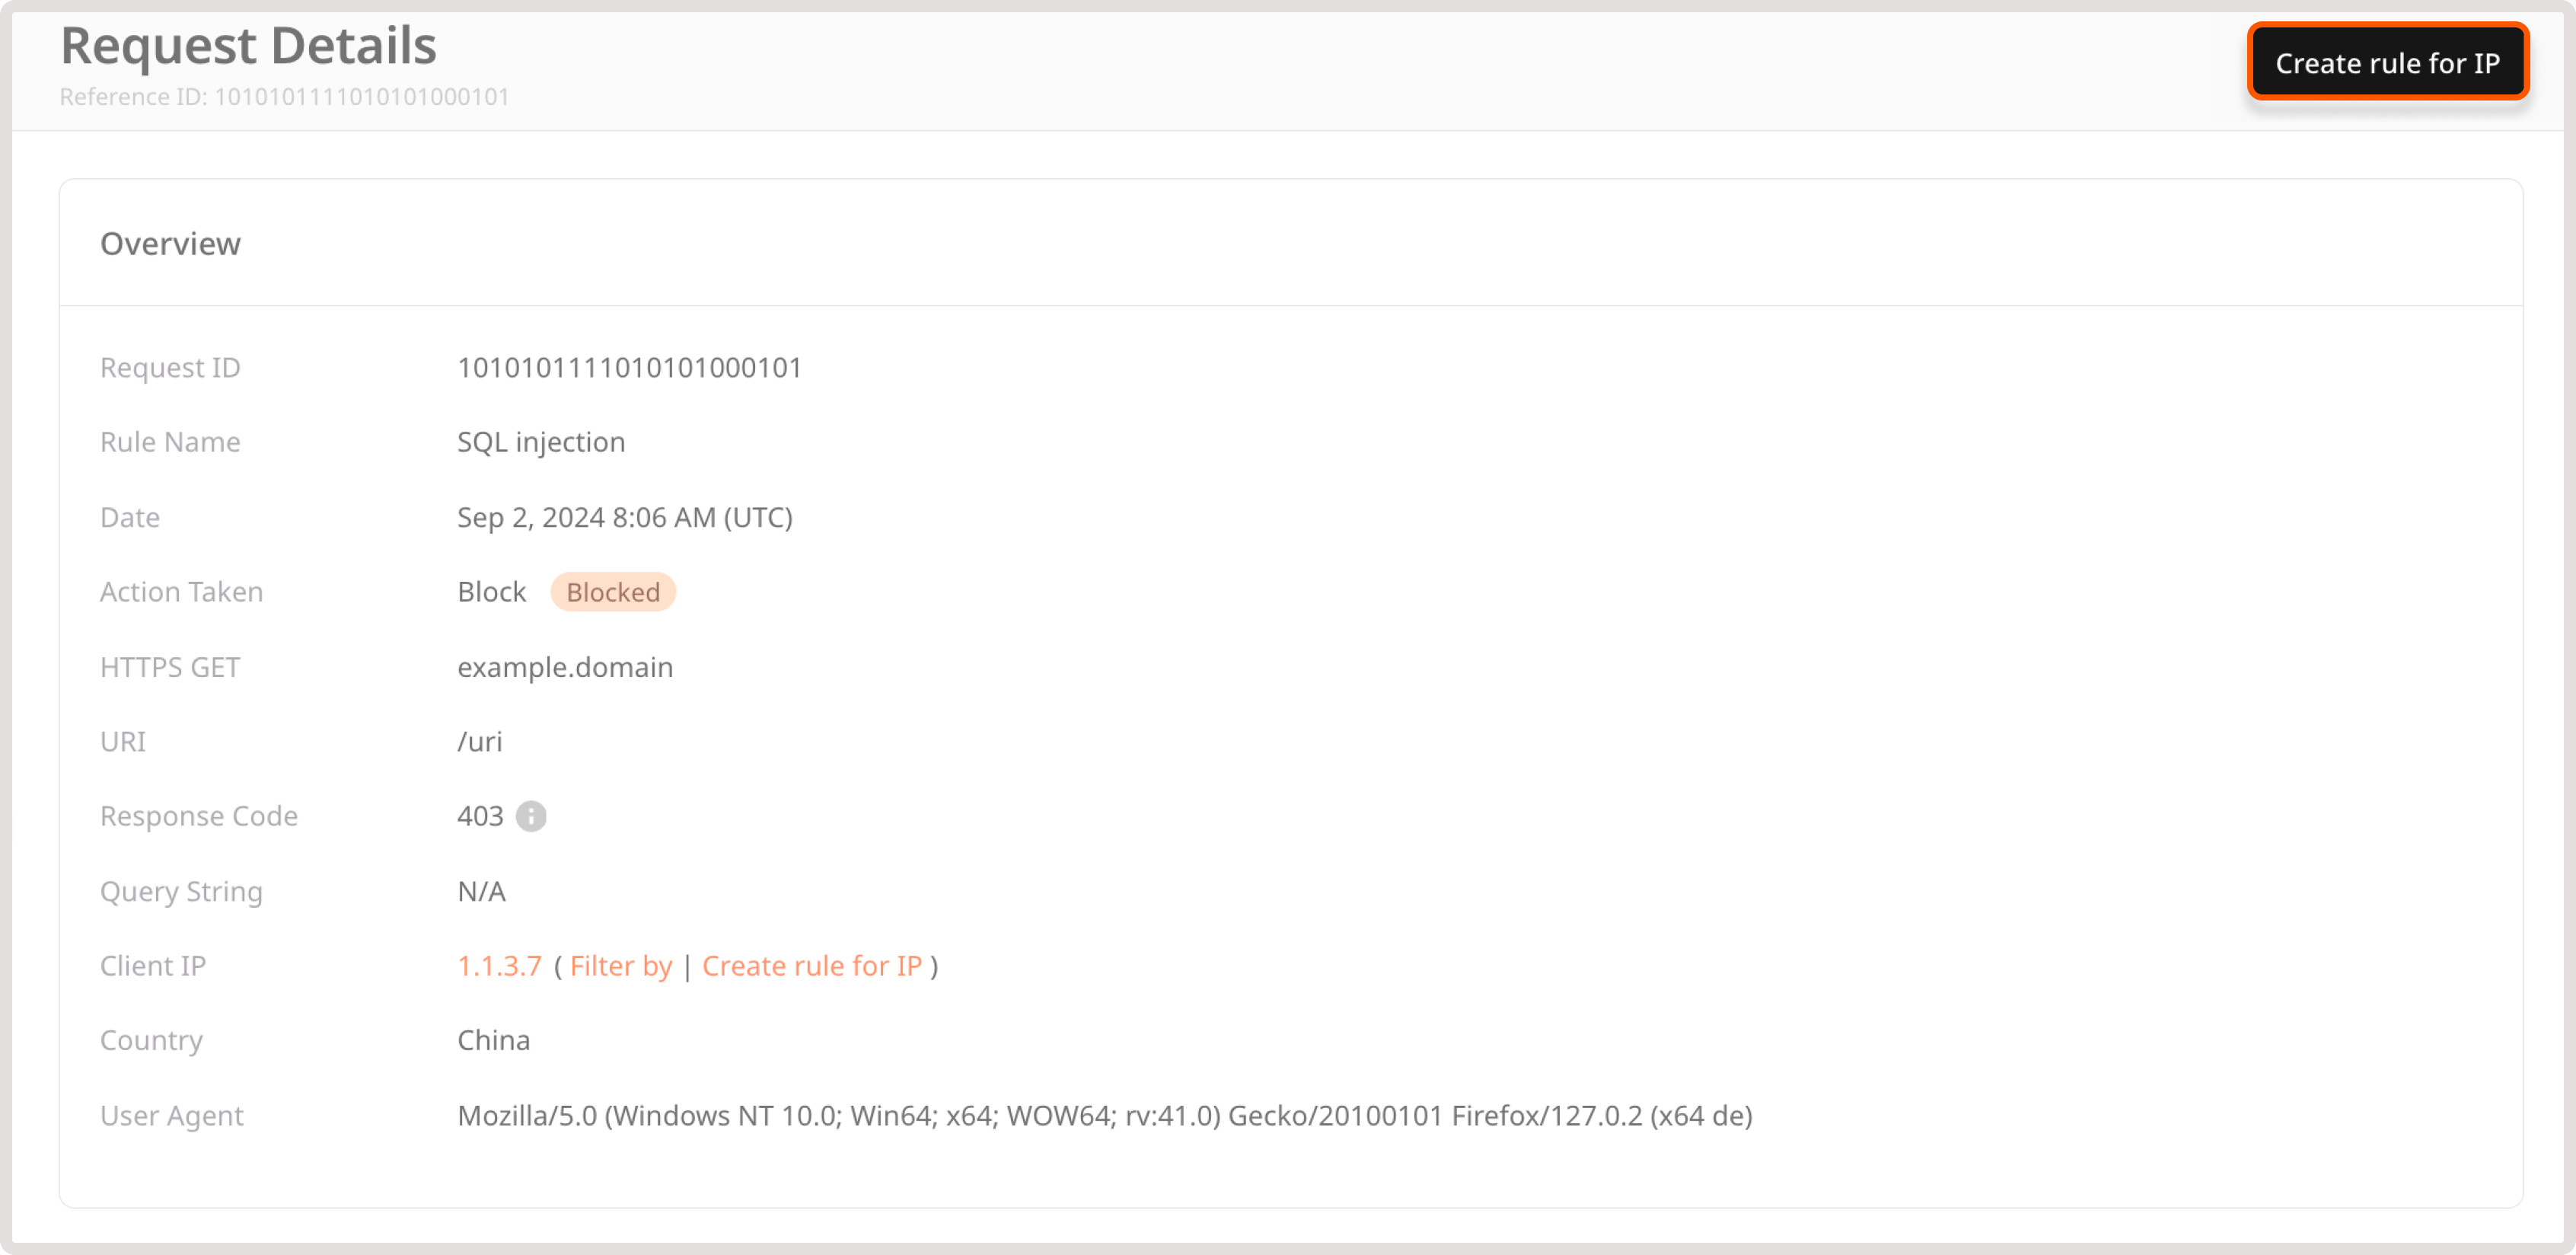
This page provides in-depth information about a particular request made to your domain. It’s structured into three sections, each focusing on a specific aspect of the request:
- Reference ID: This ID is unique to each chain of requests that triggered a particular policy or custom rule. By using reference ID, you can search through your requests and determine why a block response page was displayed to that user.
- Overview: Provides a high-level summary of the request, including relevant rules and applicable actions, response code, and client details. Click Filter by to view all requests coming from the filtered IP.
- Additional information: Includes a detailed overview of the client, associated organization, and device (if available).
- Headers: Contains a complete list of HTTP headers included in the client request and response from the server.
- Tags: Lists any tags associated with the request, helping you quickly identify malicious activities related to that request.
You can also create a rule for the IP address from which the request originates:
1. In the top-right corner of the screen, click Create rule for IP.
2. Choose the relevant action:
- Allow requests from this IP
- Block requests from this IP
- Challenge requests with CAPTCHA
- Challenge request with JavaScript validation
3. Click Create rule.
The rules to block or allow requests will appear on the Firewall page. The rules to challenge requests with JavaScript or CAPTCHA validation will appear on the WAAP rules page.
Threats (last 24 hours)
This section displays the most triggered actions and default policies, along with how many times each of them was triggered. It includes two tables:
- Top Threat Actions: Shows the actions that were triggered most frequently.
- Most Active Rules: Shows the rules that were triggered most frequently.
Top threat origins
This map and table display the origin location of bad requests (threats) from the last 24 hours. You can view the country from which requests are coming and the total number of requests for that country.
L7 DDoS page
We provide detailed analytics related to any DDoS attacks that were detected in your domain. DDoS analytics is stored for 32 days.
In-progress attacks
If there is an active DDoS attack, you’ll see a banner at the top of the page in the Customer Portal.
Clicking the View attack link will take you to the DDoS analytics page, where you can view more details related to that specific attack.
Attacks over time
Requests associated with DDoS attacks are presented in a plot format.
To filter DDoS request data by the timeframe of each attack, click the dropdown menu in the top-right corner of the screen and select the checkbox next to the attack you want to view. You can view up to four sets of timeframes simultaneously.
IPs participated
This table displays a list of the top IP addresses associated with the selected DDoS attack, along with the total number of times each IP has made a request to your domain.
URLs targeted
This table displays a list of the top URLs that were requested during a DDoS attack, along with the number of times each URL was requested.
User agents
This table displays a list of the top clients, tools, and user agents associated with the selected DDoS attack. It also shows the total number of times each of them has made a request to your site.
Attack requests
This table displays more fine-grained information about requests associated with attacks. You can search for specific attacks by clicking the Select field dropdown and entering an IP or response code.
| Table column | Description |
|---|
| Request ID | A unique identifier assigned to each HTTP request. Click the ID to open the Request Details page, which provides comprehensive information about the request. |
| Date | The date and time when a rule was triggered or a request occurred. |
| IP | The origin IP address of the client. |
| Response Code | HTTP code returned in response to the request. |
| URL targeted | The URL that was requested during the attack. |
| Security Action | The action that was taken against the request:
- Allow: Display requests that were allowed to pass.
- Block: Display requests that were blocked.
- CAPTCHA: Display requests that got the CAPTCHA validation screen, regardless of whether the request passed or failed the validation.
- Handshake (JavaScript validation): Display requests that were presented with a JavaScript validation screen, regardless of whether the request passed or failed the screen.
|
| Result | The result of the request based on the enforced action. For example, if a request was presented with a Captcha, and the request didn’t pass, then the result is “Blocked”. |
| Create rule | A button that you can select to create a rule for the IP address. |
| Threats (last 24 hours) | This section displays the most triggered actions and default policies, along with how many times each of them was triggered. |
