



When your code runs across 100+ edge locations worldwide, understanding what each worker is doing becomes critical for debugging, optimization, and reliability. FastEdge provides logging and timing capabilities that give you visibility into every request processed at the edge.
This post covers Build a Cache Purge API on FastEdge — a pattern for adding observability to your edge workers.
Why Edge Observability Matters
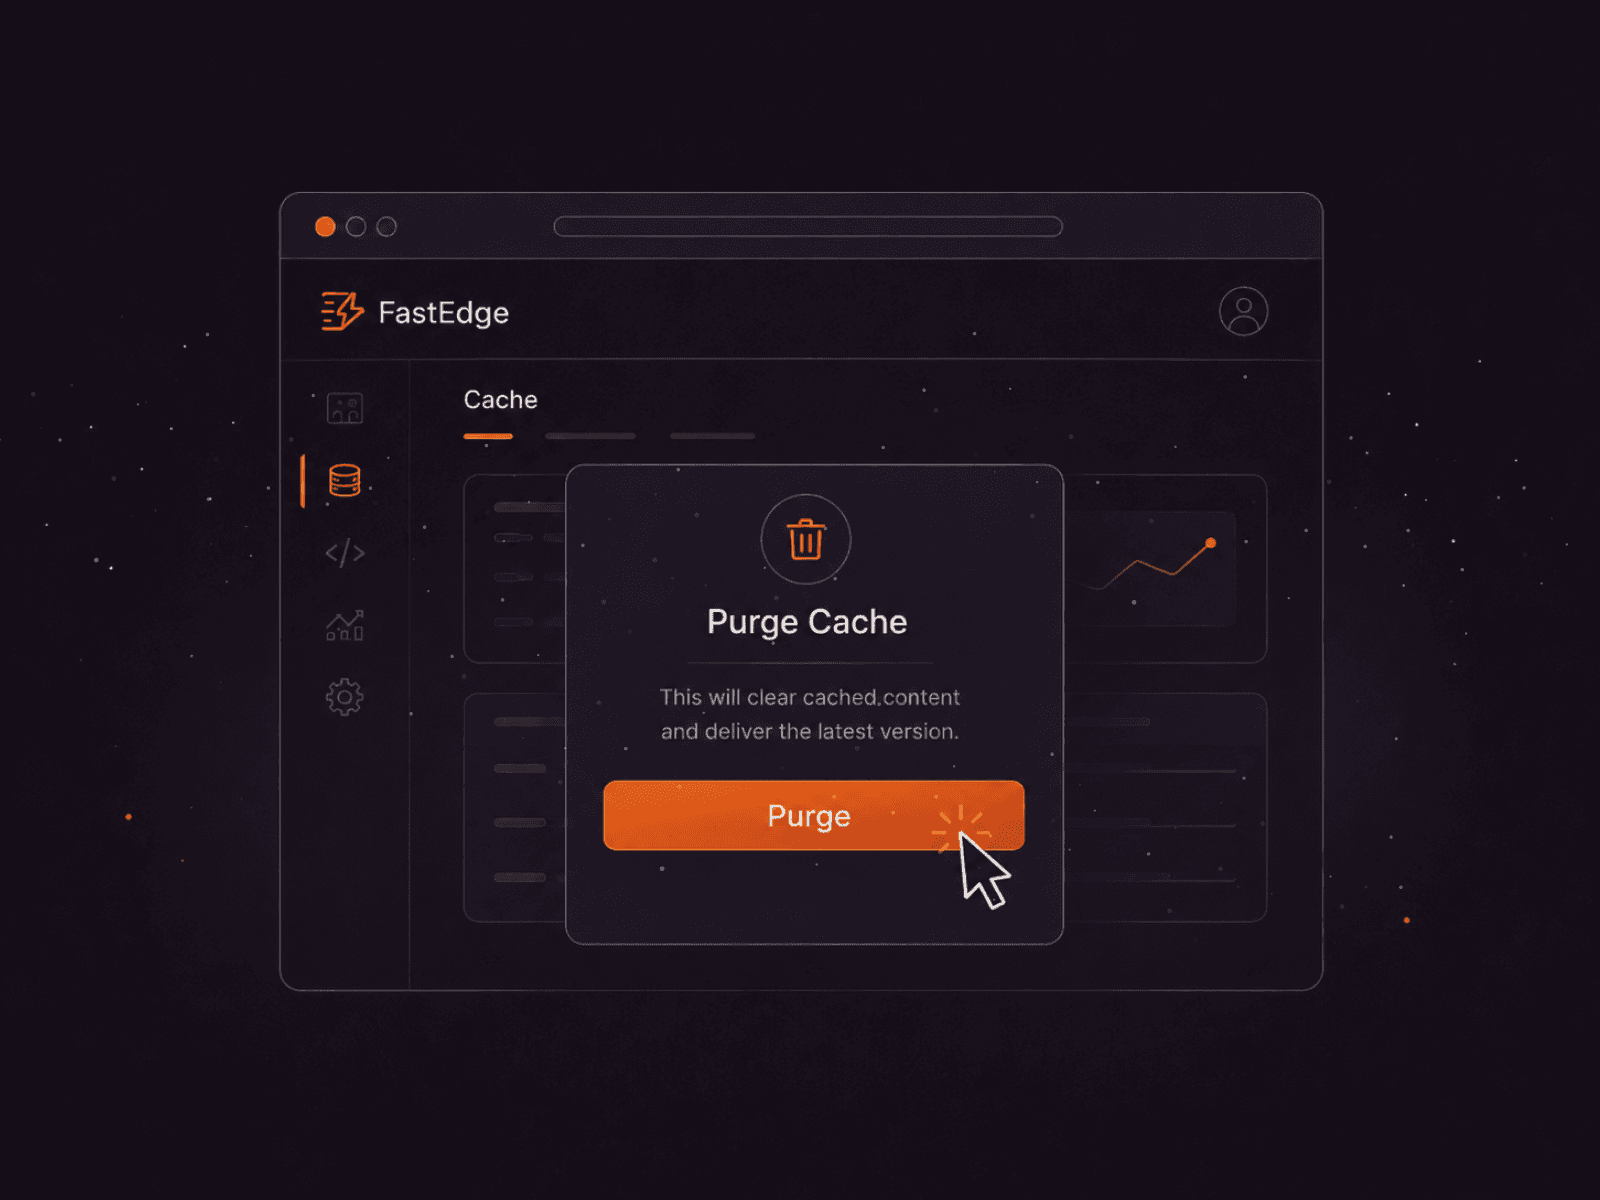
Create a programmatic cache purge endpoint running on FastEdge itself — invalidate cached content across the edge network with a single API call.
Without observability at the edge, you're flying blind. A slow response could be caused by a cold start, a network issue at a specific PoP, or a bug in your edge logic — and you'd have no way to tell which. Adding logging and timing to your workers turns them from black boxes into transparent, debuggable components.
Implementation
Here is how you add request timing and logging to your FastEdge worker:
What You Can Track
- Request timing — how long each phase of processing takes, including routing, KV lookups, and HTTP calls.
- Error rates — identify failing edge workers across specific PoPs.
- Cache hit ratios — optimize your caching strategy based on real data.
- Geographic distribution — understand where your traffic originates.
- Cold start frequency — monitor how often workers are being initialized fresh.
Log Levels
The FastEdge SDK supports standard log levels: trace, debug, info, warn, and error. Use them appropriately to avoid noise while retaining the ability to debug production issues:
Related articles



Subscribe to our newsletter
Get the latest industry trends, exclusive insights, and Gcore updates delivered straight to your inbox.