



How Gcore and AVEQ diagnosed live stream stalls for a national broadcaster
- August 4, 2026
- 5 min read
Try Gcore Network
Try for freeReal streaming problems rarely show up with a label on them. The broadcaster's ops team is fielding complaints. A dashboard glows with elevated stall counts. Meanwhile the CDN logs look perfectly healthy — latency is nominal, cache hits are high, nothing's on fire. And the picture still stalls for people at home.
That was the setup for one of the more satisfying investigations we've run: a 24/7 channel for a major national broadcaster, with a two-hour DVR window, streamed to millions of viewers. Broadcast-grade — where tolerances are brutal and the margin for error is milliseconds. We found the real problems across four layers and tuned them out one by one, with QoE ground truth from the team at AVEQ and their Surfmeter probes.
The one-line version: Some stalls were real. Some were the measurement lying to us. The most interesting one was a timing race no dashboard was built to see. Fixing all three is what broadcast-grade actually means.
The challenge: QoS and QoE are not the same
The terms Quality of Service and Quality of Experience get used interchangeably all the time — which is exactly how you end up staring at a green dashboard while viewers rage-quit. They measure different universes.
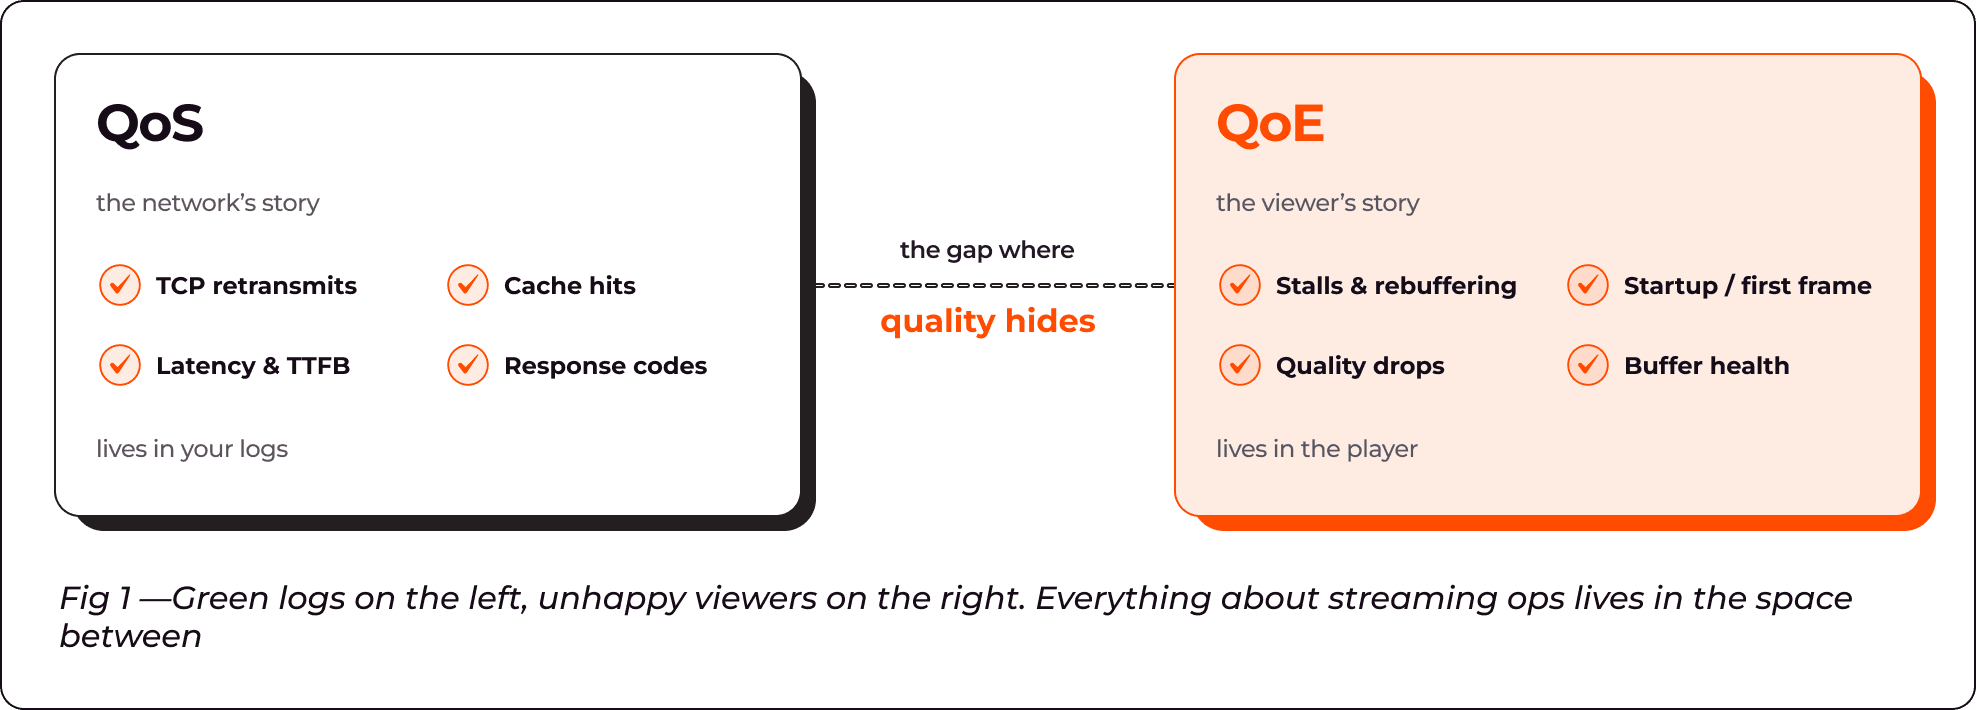
QoS is the network's story: latency, packet loss, TCP retransmissions, cache hits, response codes. It's objective, it lives in your logs, and — the trap — it's largely independent of what any one person sees on screen.
QoE is the viewer's story: does it stall, does it drop to a blurry rendition, how long to first frame. It's measured at the player, not in the pipe. A stream can post gorgeous QoS numbers and still be a miserable watch. Closing that gap is the whole game.
In terms of QoE and what users notice, we treat a video freeze of 100 ms or longer as a stall. Anything below that will likely not be perceivable, per AVEQ's research.
What "something's wrong" looked like
When Gcore was notified of the problem, we collected a list of specific issues:
- Viewers were seeing visible quality drops and frequent rendition switches mid-playback.
- Stall counts were running higher than the best-in-class CDNs carrying the same stream under the same conditions.
- Mean Opinion Score (the viewer quality score, via AVEQ) sliding from a healthy 4.5 to 3.4.
- One ISP was performing consistently worse than the rest of the pool.
The broadcast bar is fewer than five stall events per 24 hours. We were well over it. So — one layer at a time.
The approach: triangulating truth across three measurement layers
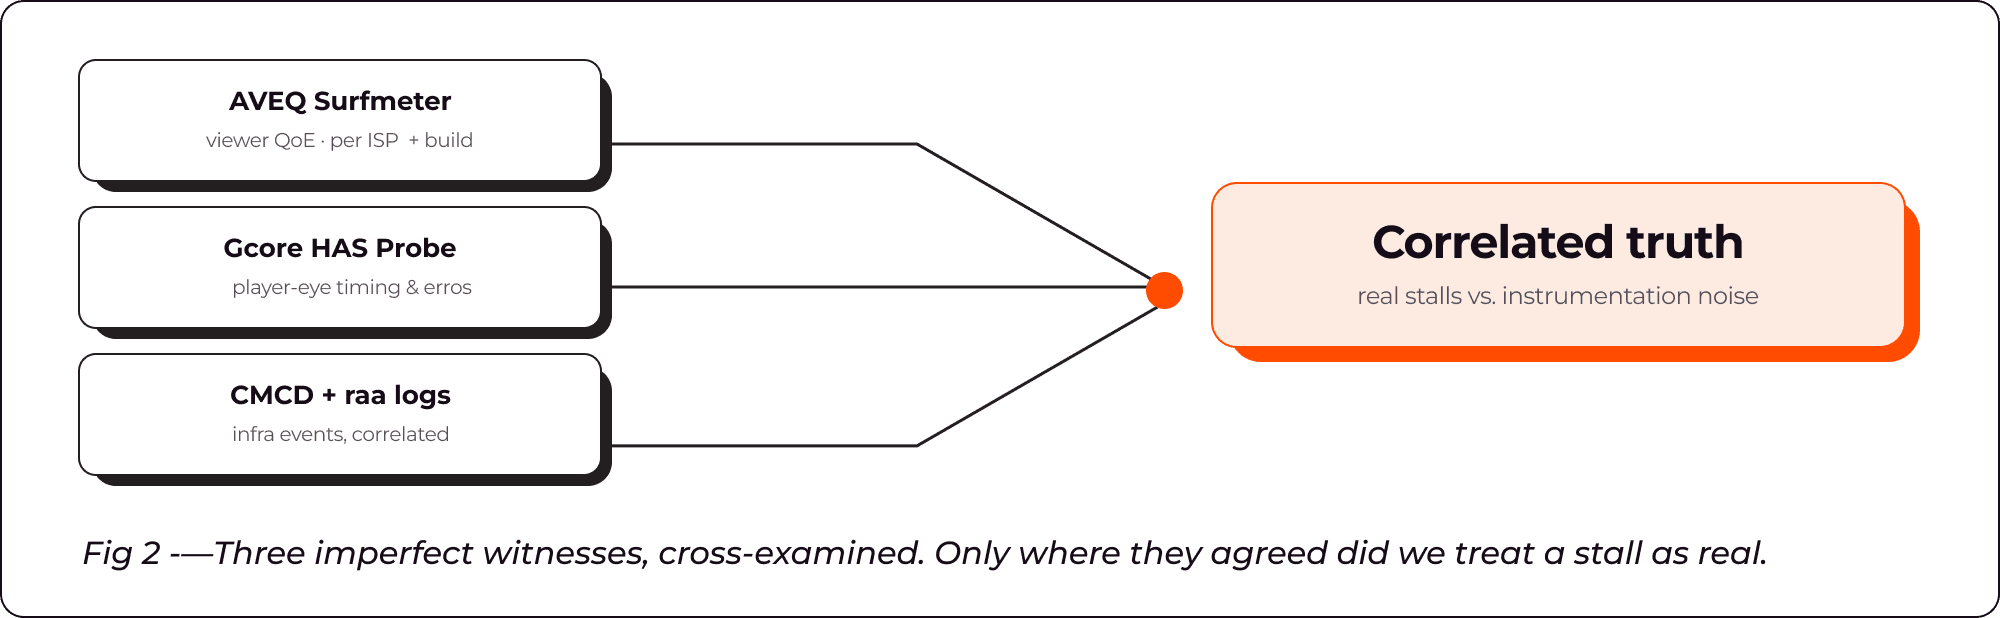
No single vantage point tells the truth on its own, so we triangulated with three:
- AVEQ Surfmeter — a client-side QoE app, deployed in several spots, including a probe wired straight to the underperforming ISP. It gave viewer-side metrics — stall counts and stalling time, down-switches, bitrate behavior, MOS — sliced by ISP and player build. CDN logs can't reproduce that.
- Gcore HAS Probe — our in-house HLS/DASH emulator. It behaves like a player but logs everything: TTFB, time-to-first-frame, manifest and segment timing, and manifest parse errors. It catches what a player hits, but a CDN log shrugs off.
CMCD + raw CDN logs — client data emitted by the players, lined up against edge logs so we could tie an infrastructure event to the exact viewer-side impact it caused.
Finding 1: giving the busiest path room to breathe
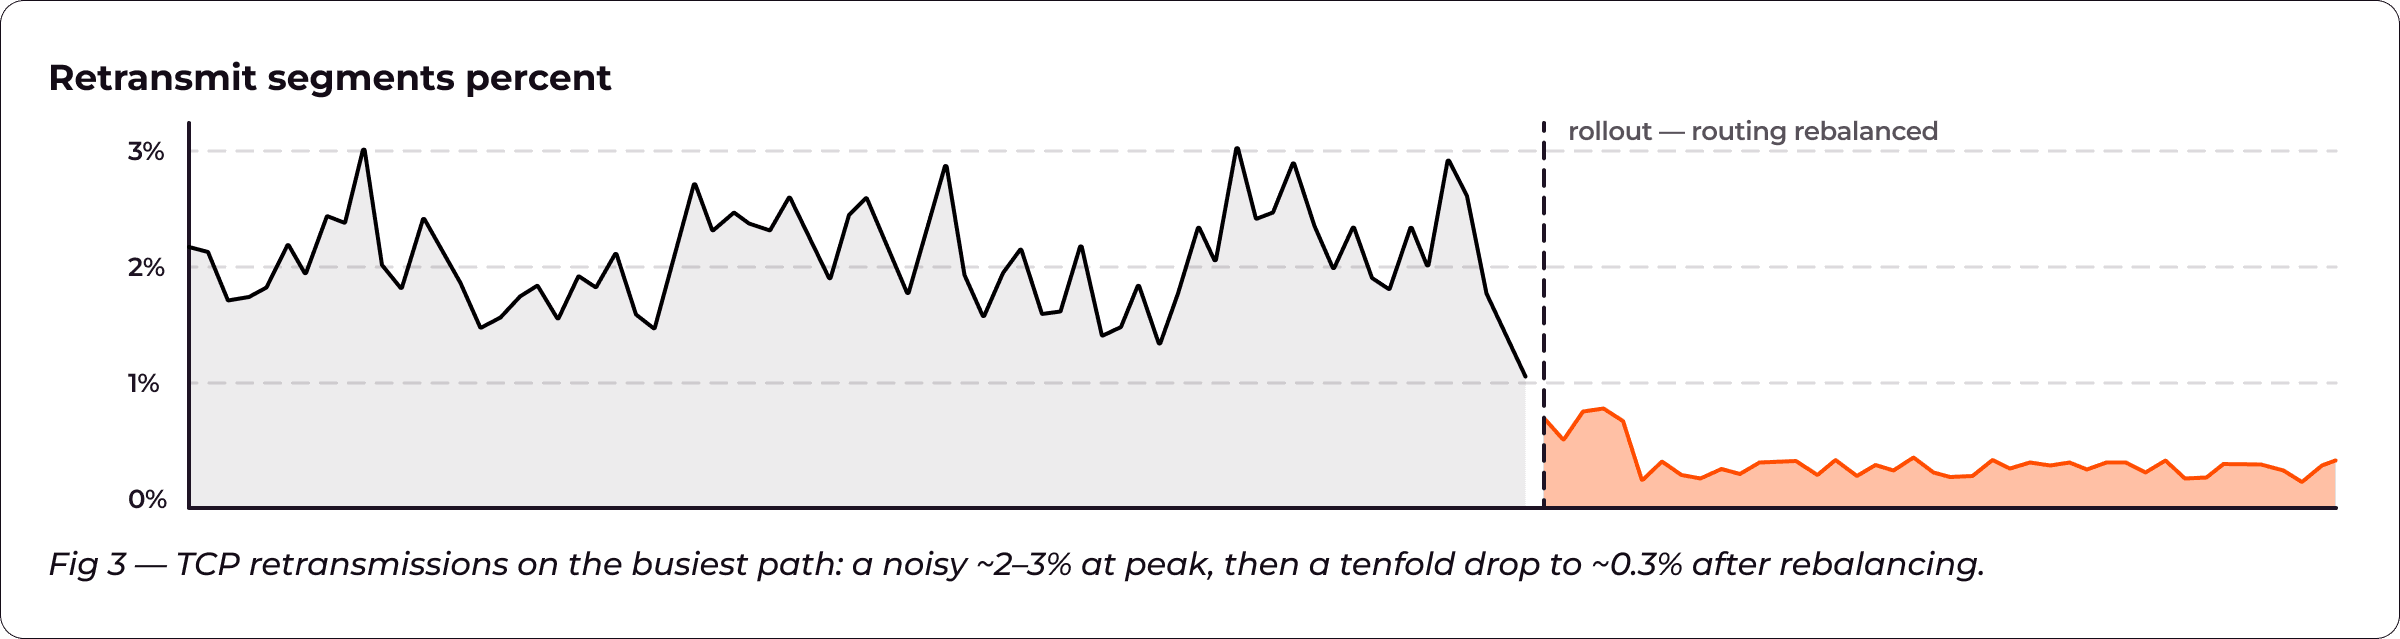
The first finding was in the network. One ISP path caused more degradations than the rest of the pool, and unevenly. At peak, its TCP retransmissions climbed higher than we like. That bites: adaptive streaming has a tight download window, so even a small bump lowers the buffer margin that prevents stalls.
The cause was simple capacity distribution: at peak, that path wanted rebalancing across facilities. We redistributed the load, opened headroom on the busiest transit, and let routing settle. Retransmissions tightened to 0.3% — a tenfold improvement — and manifest and segment timing sharpened with it.
One QoS number is easy to misfile as a viewer metric: mean delivery duration — server-side processing time, read straight from raw logs, with no client round trip in it. It landed at 23.1 ms, inside the 30 ms target.
Finding 2: when the measurement is the bug
Here's where it got fun: some of the stalls we were chasing weren't noticeable.
Micro-stalls: ghosts in the counter. Running Surfmeter against individual quality profiles, we saw "stall" durations absurdly short — well under the 100 ms bar. These micro-stalls were padding both our counts and the broadcaster's reference stats. To help focus on what matters, AVEQ configured Surfmeter to ignore any stalling below 100 ms, we recomputed every affected test, and the baseline dropped.
Player bugs wearing an infrastructure costume. By working together with the broadcaster, we had access to several player versions, including historical ones. Older builds of the broadcaster's reference player were generating false-positive stalls of their own. With AVEQ's data and our CDN log analysis, the player team pinned the trigger. Two releases solved most of the issues — the first alone cut stalls by about 20%.
Your player and your measurement tools are part of the quality stack, not neutral observers of it. A CDN investigation that never looks at the player will misattribute problems all day.
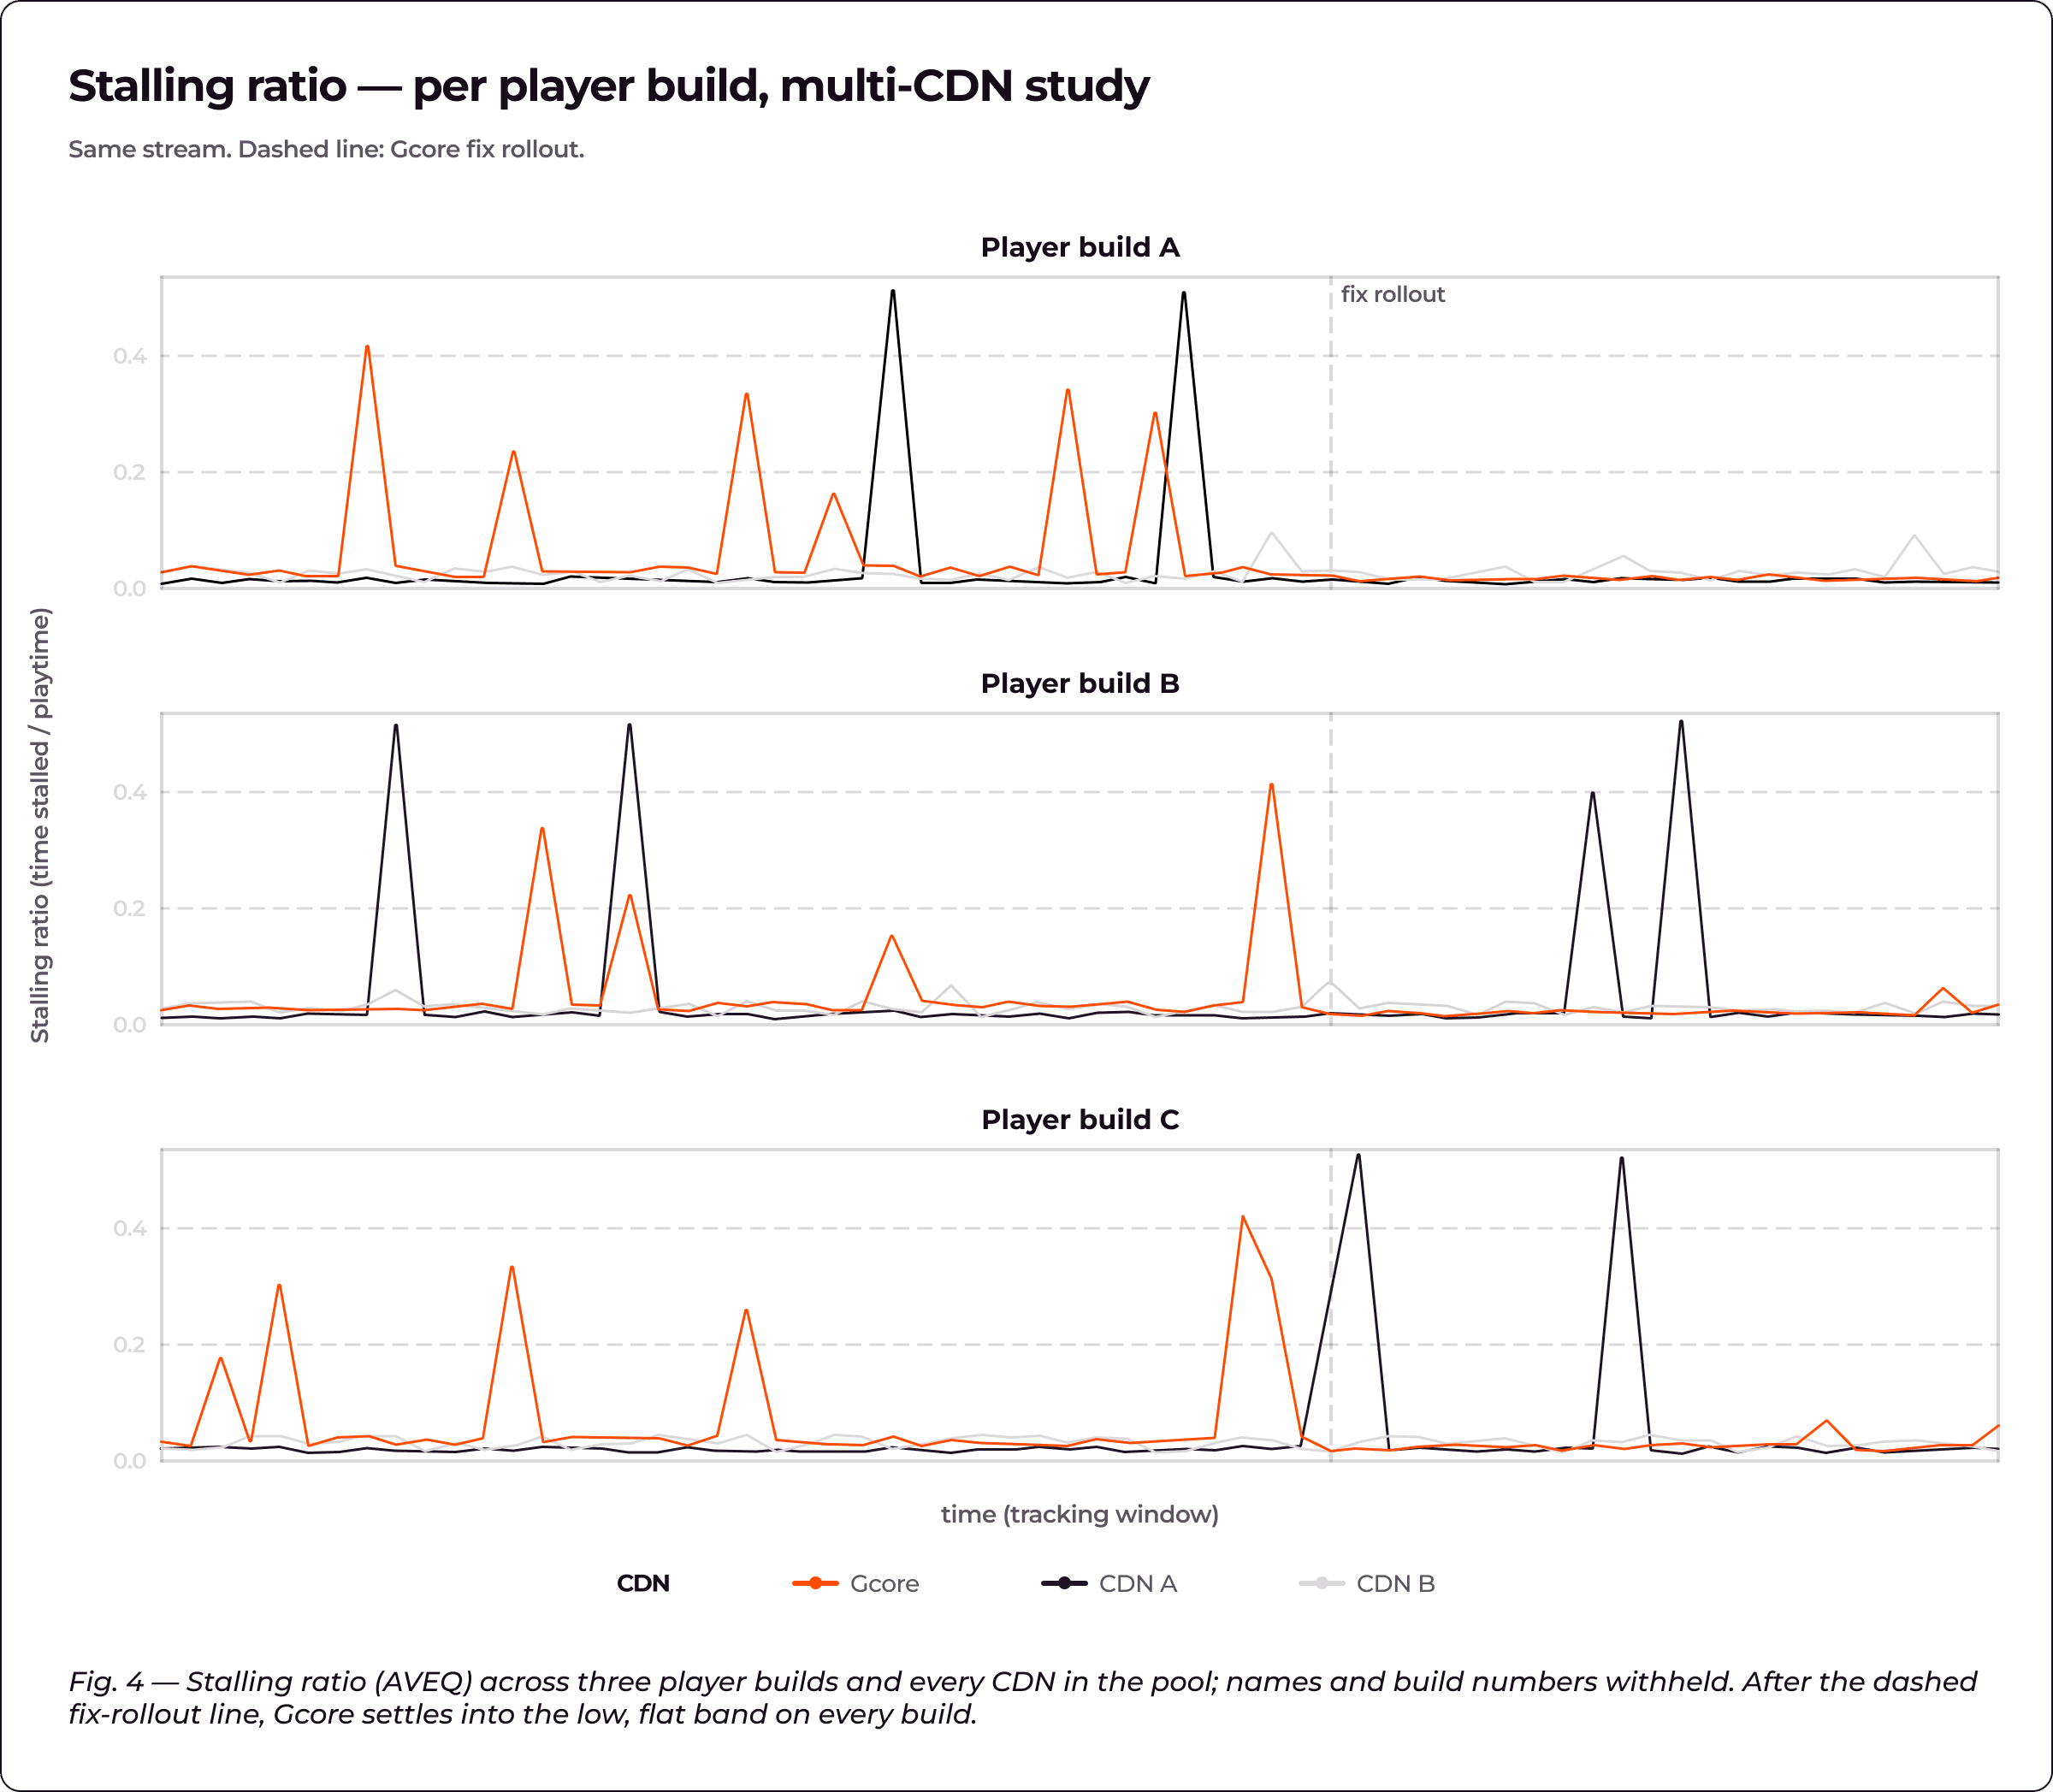
Because Surfmeter watched the whole multi-CDN setup at once — the same stream through Gcore and the other CDNs, across every player build — we could slice stalling by build and by CDN, separating a player quirk from real CDN behavior instead of guessing. Before the fix, spikes were everywhere, competitors included. After it, Gcore significantly improved its metrics, dropped into the low, flat band and stayed there on every build, while some CDNs kept spiking.
Finding 3: a race condition nobody's dashboard could see
The most interesting find came from HAS Probe's manifest timing — the kind of bug no health dashboard shows.
In the broadcaster's case, the stream uses 2-second segments and a big manifest: a two-hour DVR window runs to about 500 KB. Stack a few caching layers in front of that and a timing race appears.
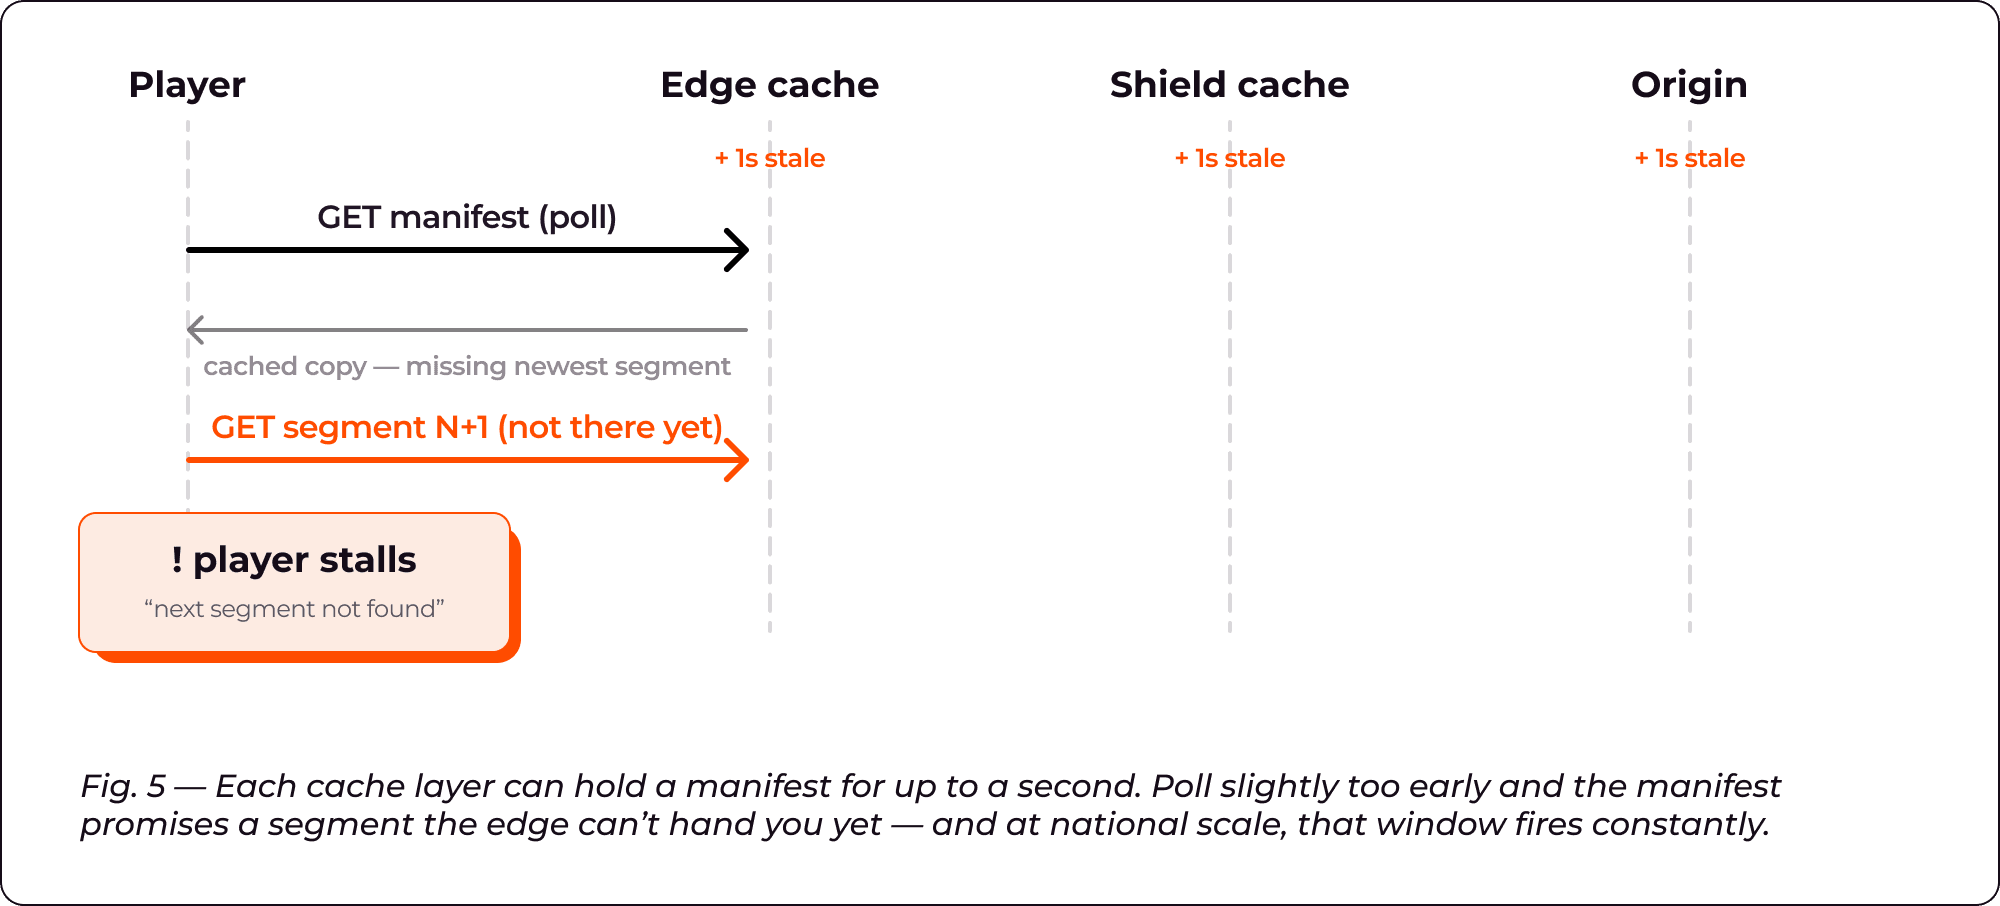
The window is tiny — it only opens when a player asks for the manifest a tiny bit before the segment boundary. But across millions of viewers, tiny becomes a steady drip of stalls. Our CDN logs showed manifest-update errors landing exactly on the stalls Surfmeter measured — theory into root cause.
The fix: sub-second freshness, no origin changes required. There were two ways out. The clean, structural one is counterintuitive: lengthen the segments, from 2s to 4s — that gives the cache more headroom against the player's polling and makes a stale manifest far less likely. We proposed it, but the origin is shared by every CDN in the pool and running in production, so a segment-length change wasn't something the broadcaster would make for one provider. Fair enough.
So, we solved it entirely on our own side, with a Gcore feature we built and proved on this workload: sub-second caching, which revalidates the manifest toward origin at sub-second granularity so the edge always has the freshest segment — no origin changes needed. We validated it on a test resource and can switch it on for the main channels on request. We also resized the shield's hot cache, so the full two-hour DVR window stays warm.
Key takeaways
A few things that generalize to anyone running live at scale:
- QoS and QoE need separate instruments. Infra metrics won't surface player bugs, measurement artefacts, or manifest races. You need the player's-eye view.
- A specialist measurement partner pays off. AVEQ's ISP- and build-segmented data was the difference between guessing and knowing.
- Manifests are an underrated quality lever. Cache TTL, segment length, and polling interval interact in ways standard dashboards never show.
Broadcast-grade quality isn't one well-configured box. It's every layer, tuned together — and proven with measurement you can trust.
Live streaming, built for broadcast scale
Gcore delivers low-latency live to millions of concurrent viewers, with proactive CMCD monitoring, sub-second caching, and a team that treats "the numbers look fine" as the start of the investigation, not the end.
Ground truth from AVEQ Surfmeter
AVEQ's Surfmeter measures Quality of Experience from the viewer's side — stall counts, quality switches, bitrate behavior, and MOS, segmented by ISP and player build. It's the layer that told us which stalls were real. Highly recommended for any serious streaming operation.
Try Gcore Network
Try for freeMore case studies

Founded in 1975, Microsoft is a global technology leader renowned for its cloud services, software, and AI innovations. Their portfolio includes widely used products and services such as Azure, Microsoft 365, Windows, and Xbox. With operati

By expanding our game coverage, we've seen a surge in new subscriptions, leading to a 133% increase in revenue within just one quarter, which is a great result.Looking back on more than two years of partnership with Gcore, we have tripled o

Sandbox Interactive GmbH is an independent game development studio, founded in 2012 in Berlin. The company strongly believes that creating their own world and interacting with other gamers are paramount to the gaming experience. Their flags

Wargaming is an award-winning free-to-play online game developer and publisher. Established in 1998, the company has more than 5,500 employees in multiple offices around the world.Over 200 million players enjoy Wargaming’s titles across all

Stage Audio Works is Africa’s largest provider of audio, video and lighting equipment serving event companies as well as large corporations, and religious organizations.The situationSince the outbreak of the COVID-19 pandemic, many of Stage

Subscribe to our newsletter
Get the latest industry trends, exclusive insights, and Gcore updates delivered straight to your inbox.