- Cost Report : view costs for all Cloud resources you’ve used. This report calculates all costs using the Pay-As-You-Go pricing model. If you have active resource commitments, the prices shown in this report won’t reflect your actual costs because commit discounts are not applied.
- Reservation Cost Report : check monthly resource usage and costs that account for your resource commitments. This report shows how much of your committed resources you’ve consumed, whether you’ve fully utilized your commits, and any overcommit costs incurred when usage exceeded the reserved amount.
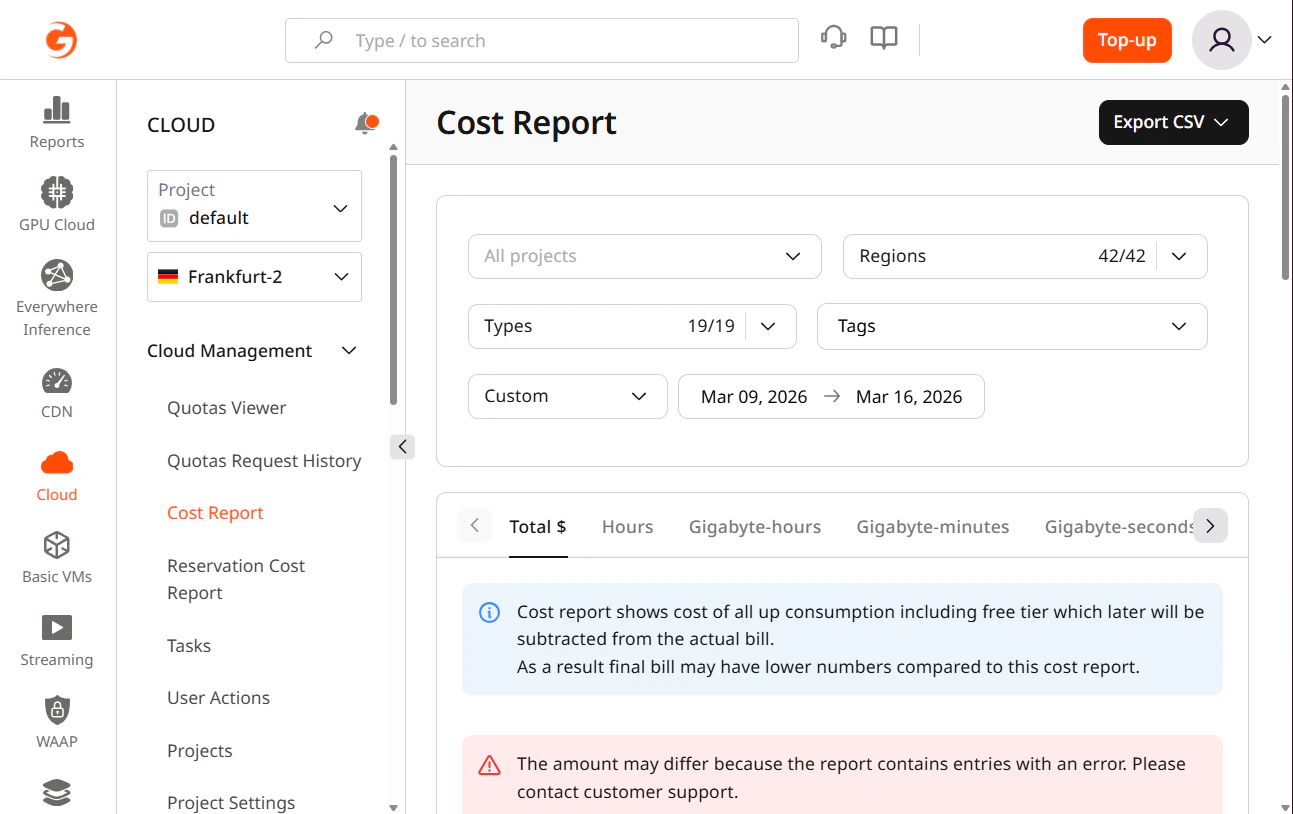
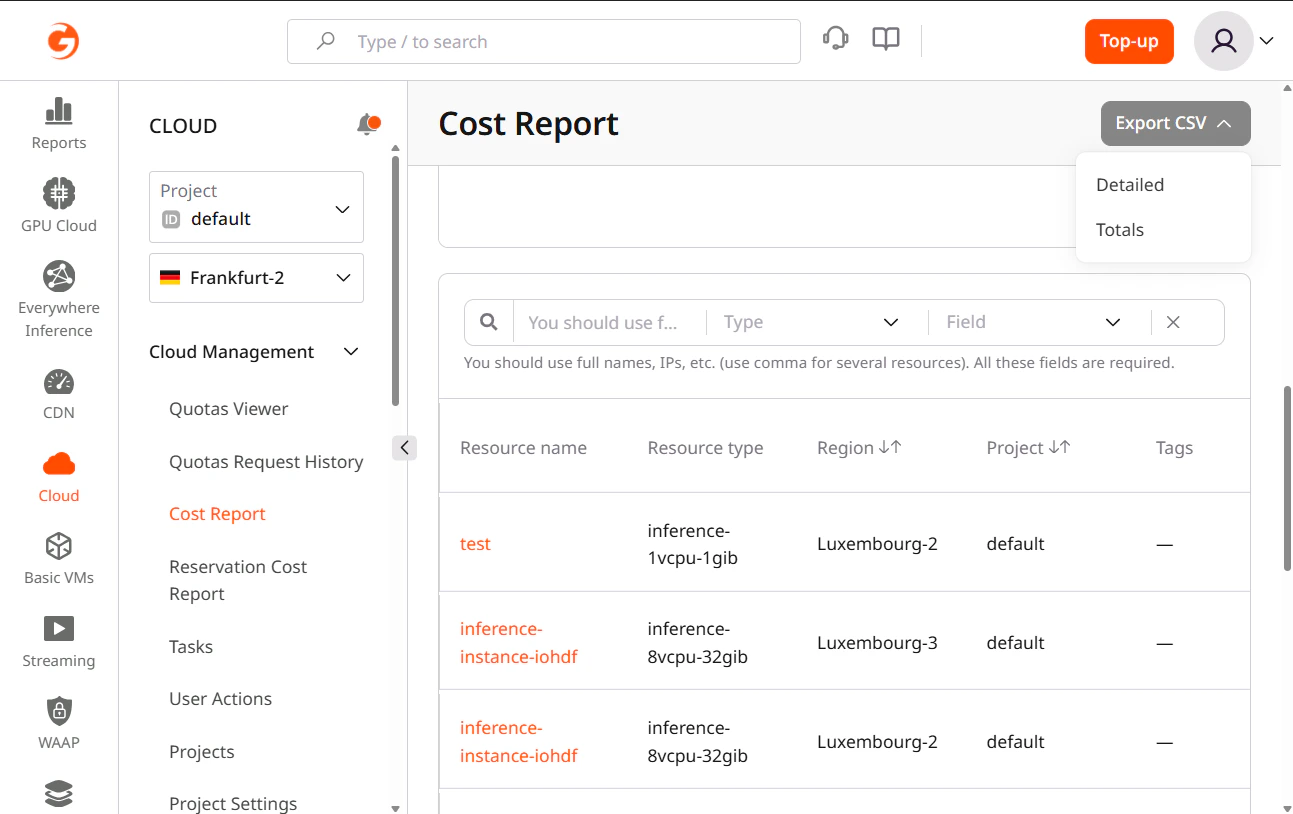
Cost Report
InfoThis report calculates all costs using Pay-As-You-Go rates and doesn’t account for resource commitments. If you have active commits, the prices shown here won’t reflect your actual costs. Check the Reservation Cost Report for accurate cost data that includes commit discounts.
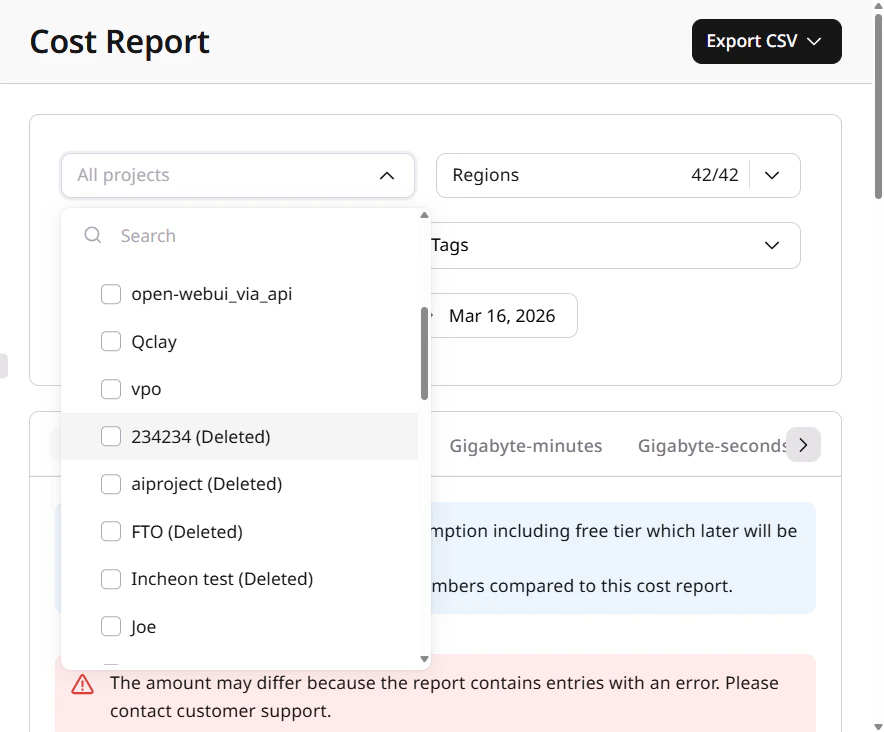
- Project : View costs for all your projects or just the selected ones.
- Region : Check costs for products created in all regions or just the selected ones.
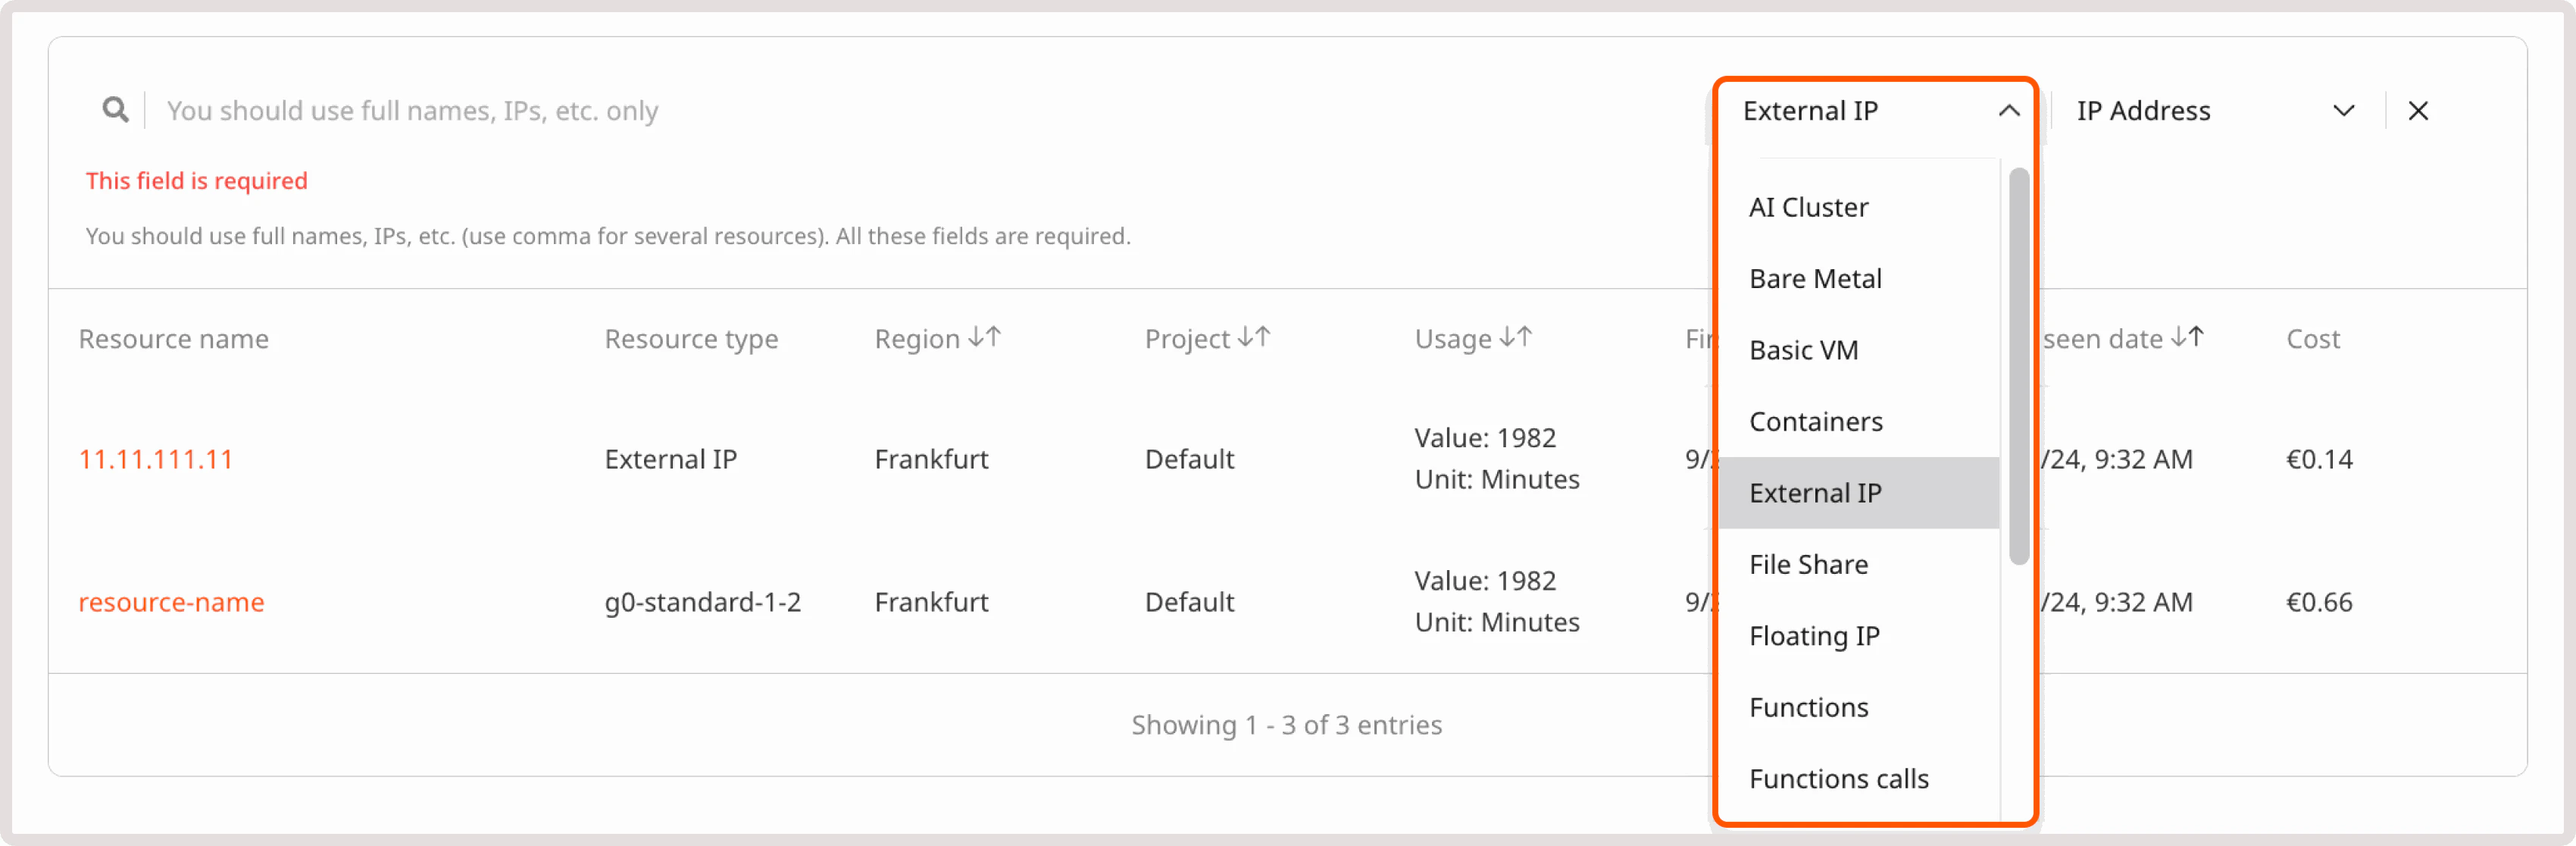
- Resource type : View costs for the selected resource types.
- Consumption period : View costs for a week, two weeks, or a custom period. Consider that the maximum period you can select is one month.
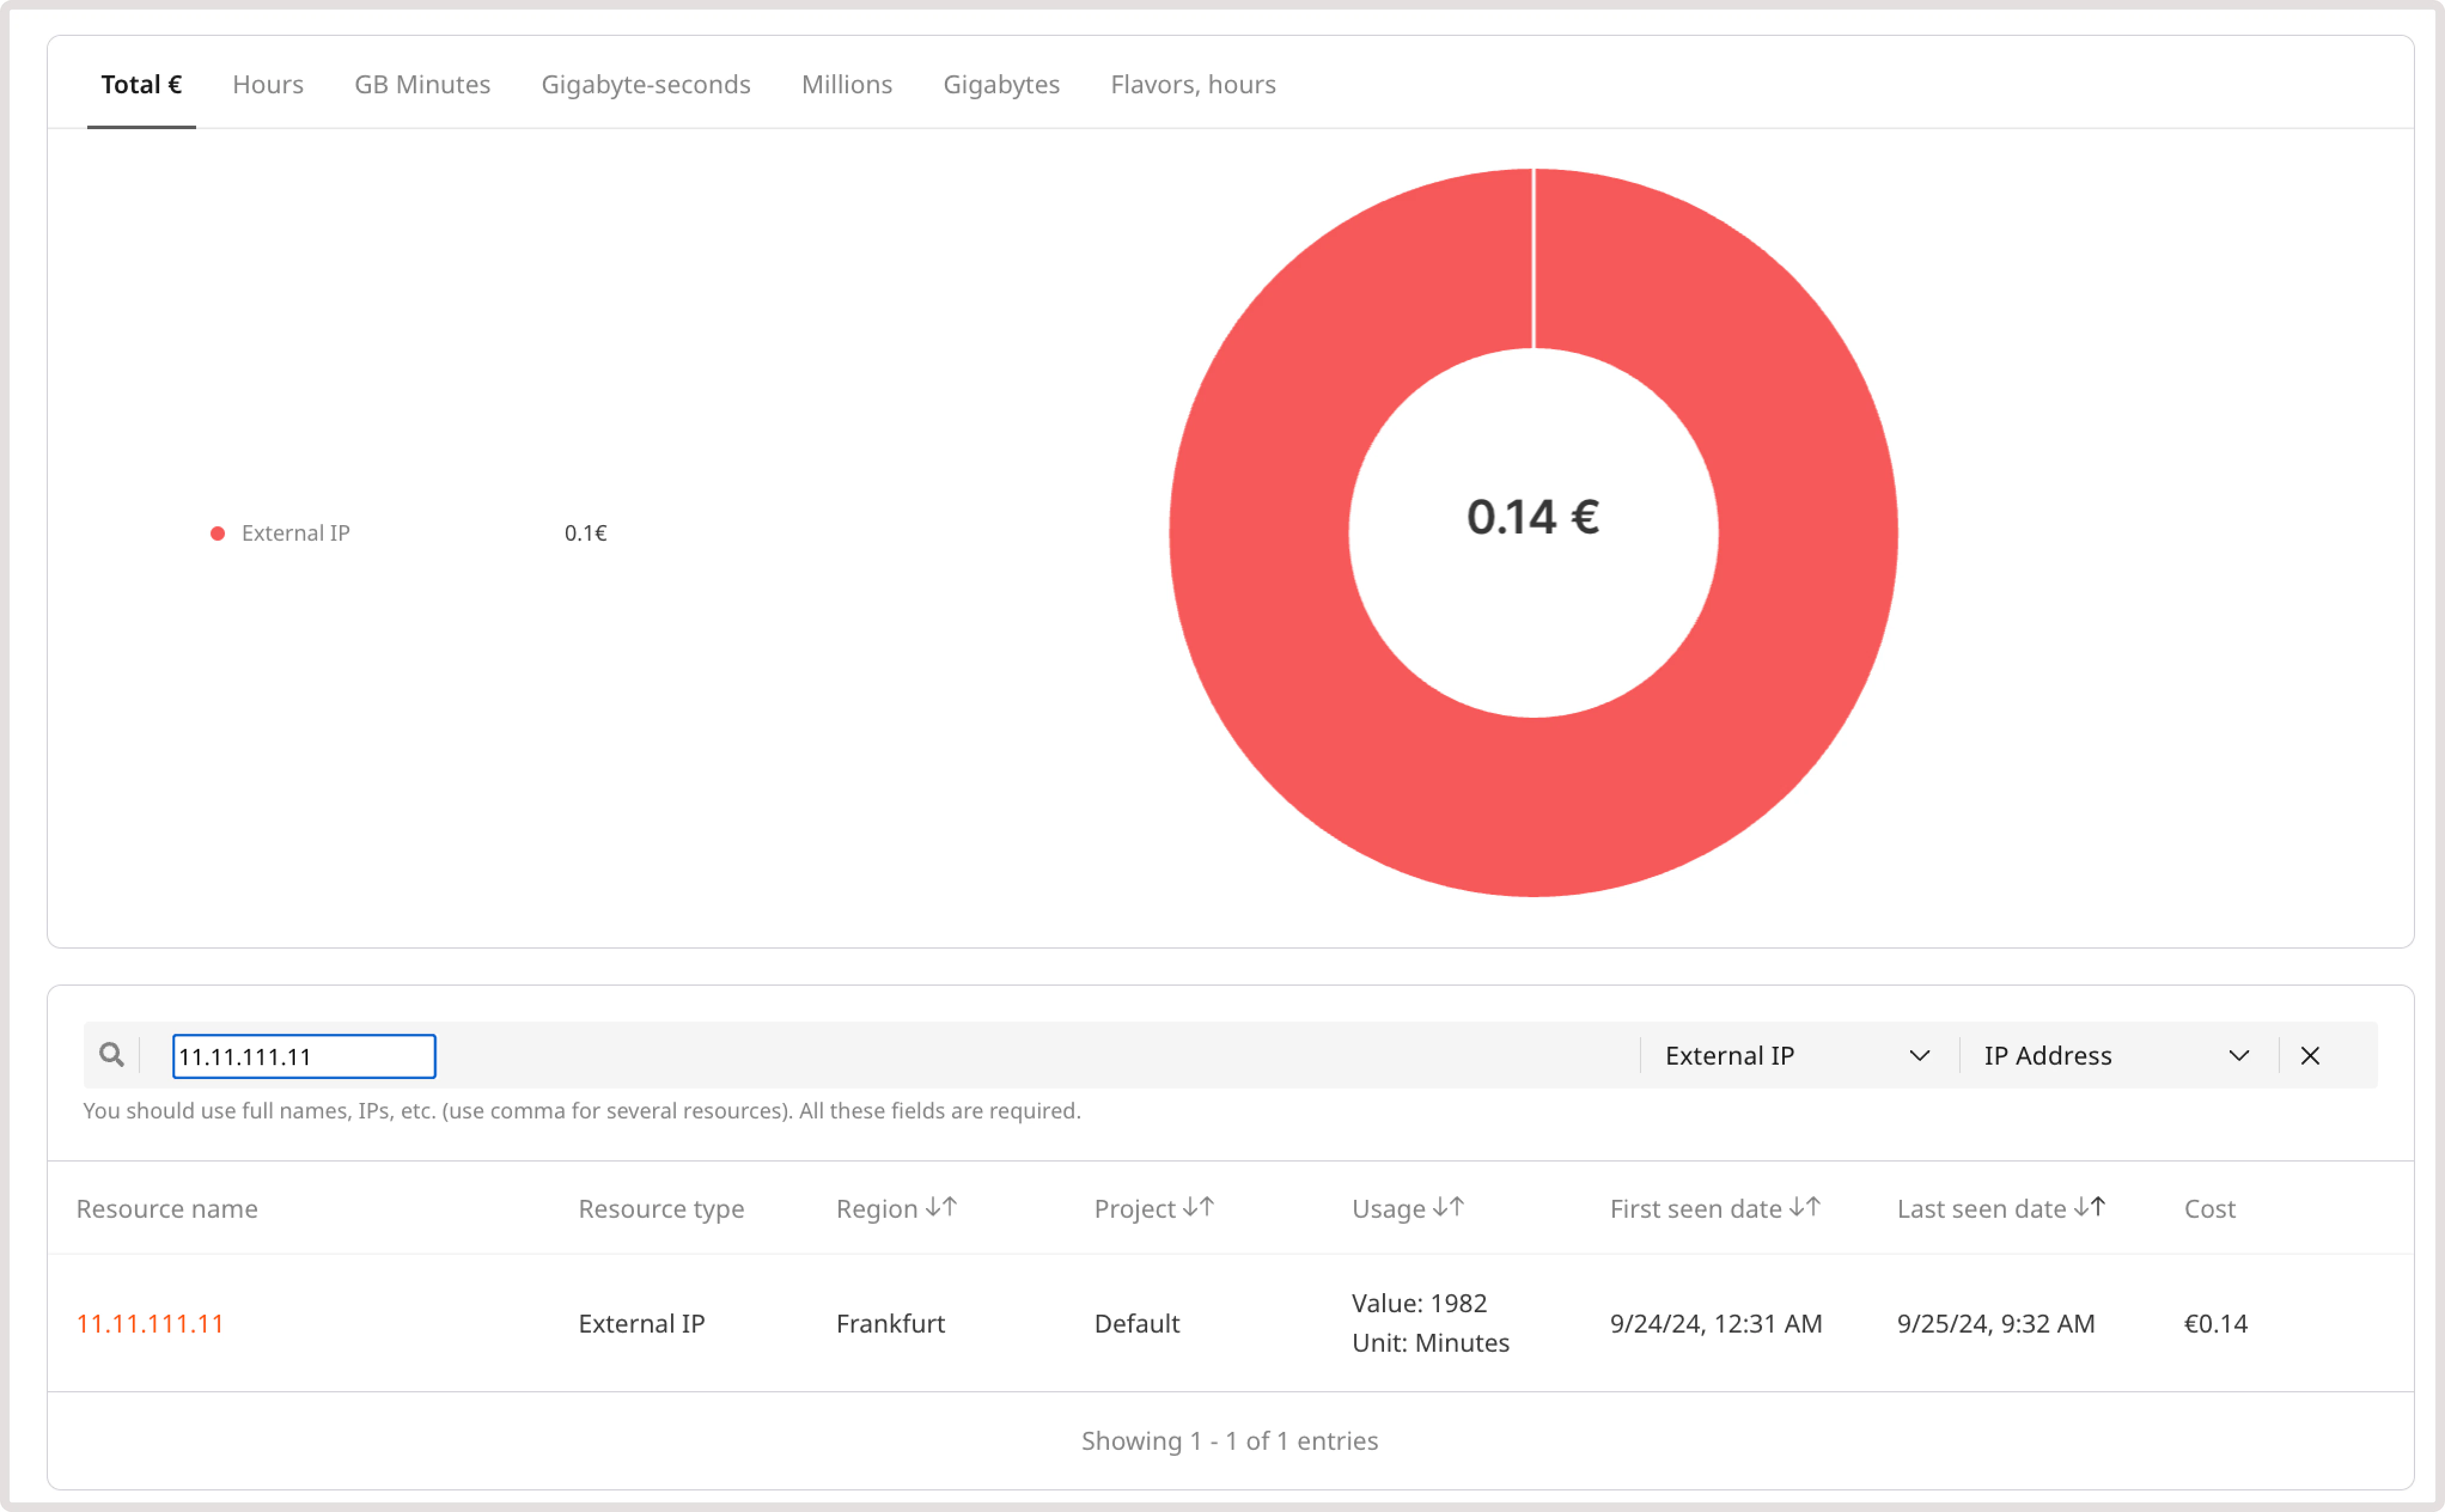
- Total balance used
- Resource usage in hours
- In Gigabyte-minutes by resources
- In Gigabyte-seconds by resources
- Millions of pieces
- Gigabytes of used resources
- The total number of outbound GBs and hours of using different flavors
- Resource name
- Resource type
- Region
- Project
- Tags
- Usage
- First seen date
- Last seen date
- Cost
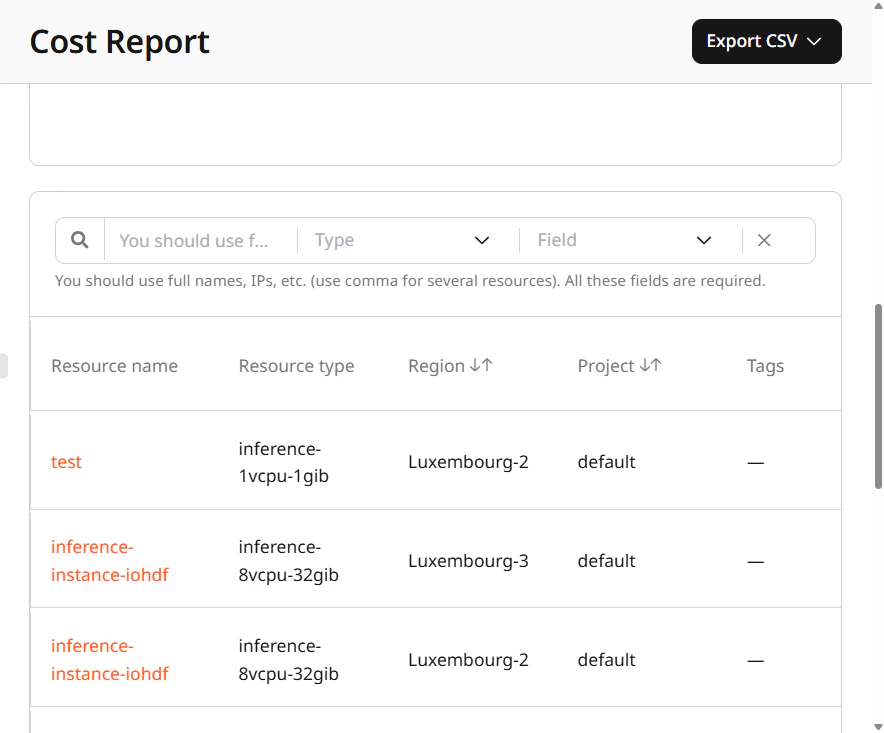
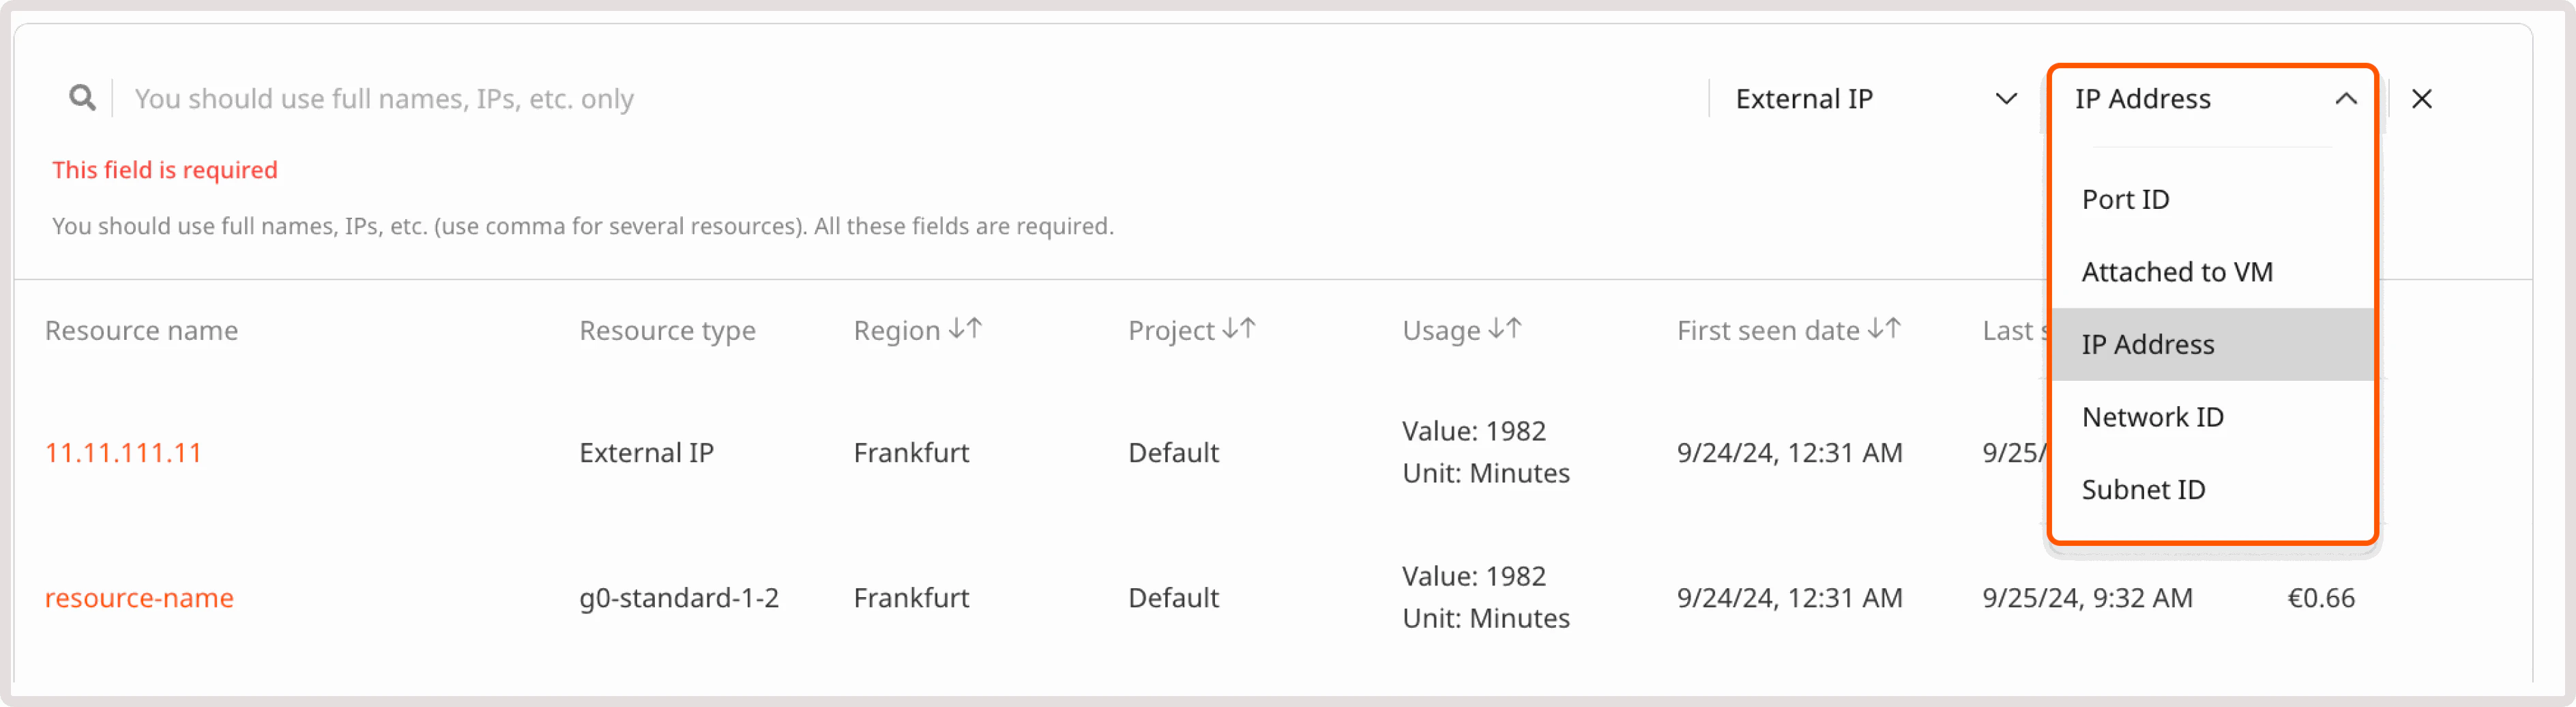
InfoCurrently, we only support full-text search.
Download Cost Report data
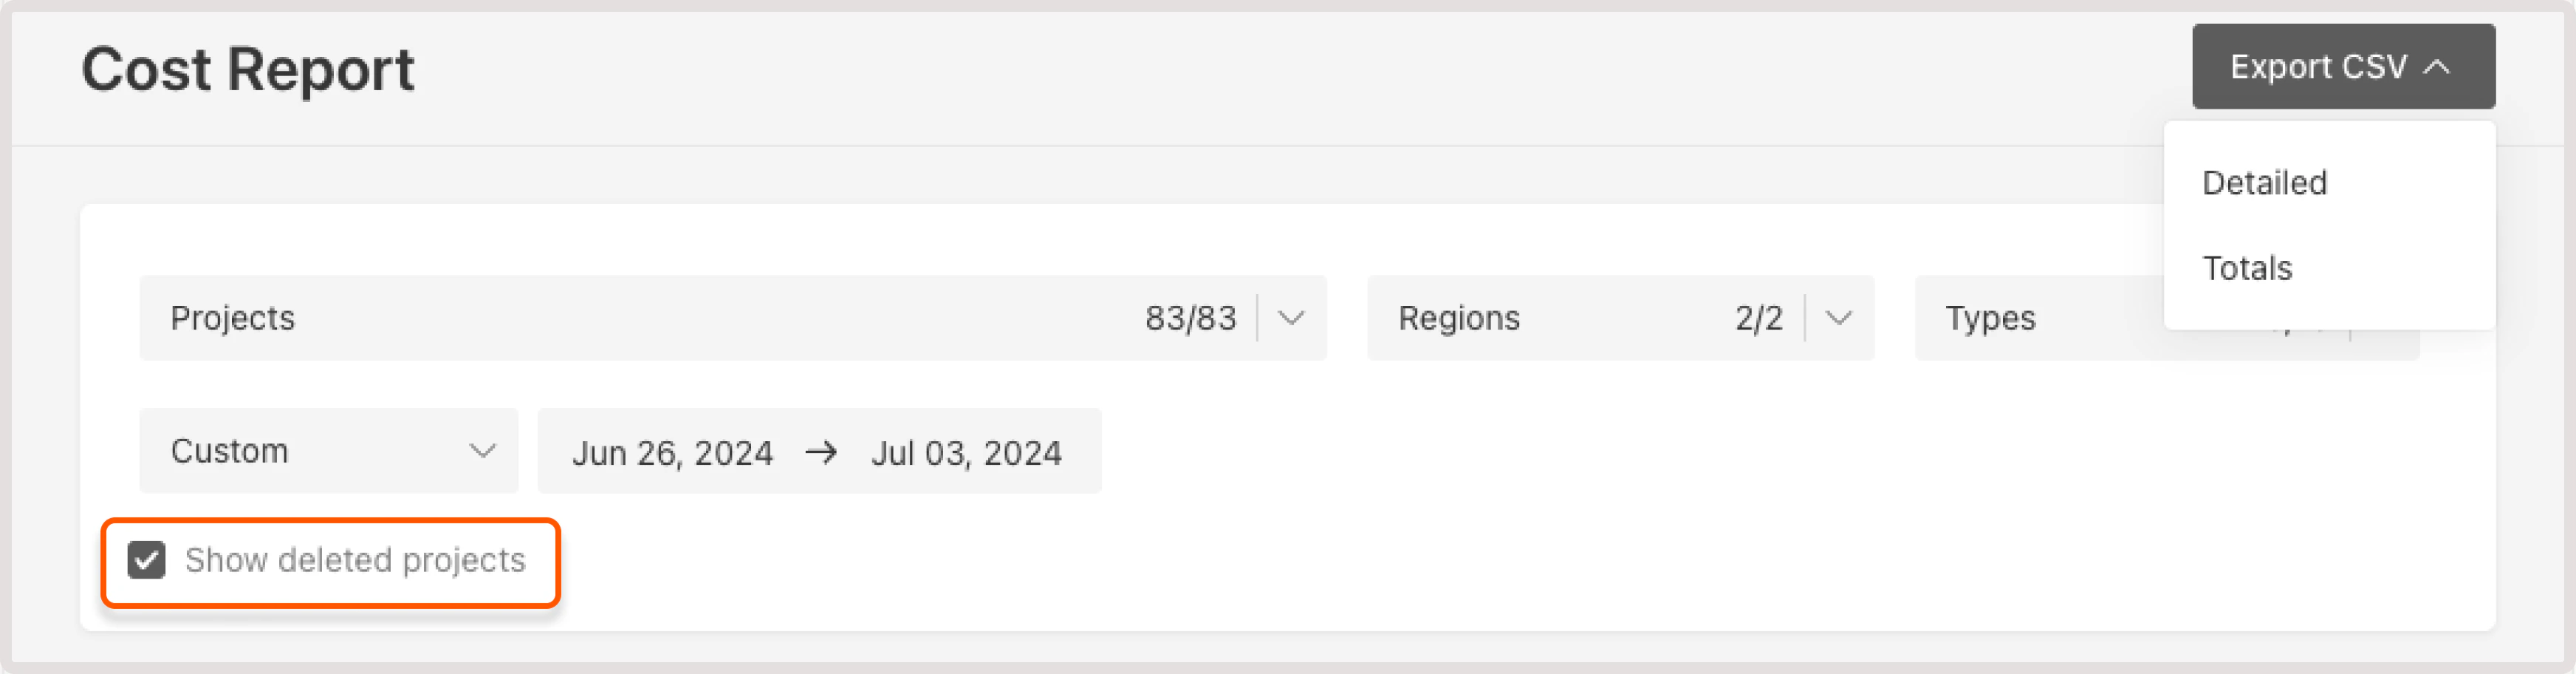
To export billing report for the selected period, click Export CSV in the top-right corner of the screen. You can download two types of files:- Detailed report : a detailed breakdown of each resource you are using.
- Totals : the total cost of resources in each location.
- Detailed CSV report
- Summary CSV report
The following table describes what information is included in the Detailed CSV report file.
| Column | Description |
|---|---|
| Service | A name of the Cloud resource that you’ve used. |
| UUID | A universally unique identifier assigned to the resource. Some resources, like IP addresses, don’t have a UUID as they’re already unique. |
| Feature | Billing identifier of a billable resource that combines the resource type, configuration, region, and pricing model. Every resource has a feature value, even resources with a single configuration like IP addresses. |
| Tags | If you added any tags to the resource, they’ll appear in this column. This column also presents system-generated tags. |
| Service_name | Name of the service, which is also displayed in the Name field in the UI. For example, the name of a Virtual Machine. |
| Region_id | ID of a region where the resource has been created. You can check the ID via API. |
| Region_name | Name of a geographical location of the data center where the resource has been created. |
| Project_id | ID of a project where the resource has been created. Your project ID is displayed on the Projects page, in the grid view. |
| Project_name | Name of a project where the resource has been created. |
| First_seen | The date when the resource was first detected in the billing system during the selected period. This helps identify when a resource started generating costs. |
| Last_seen | The date when the resource was last detected in the billing system during the selected period. This helps identify when a resource stopped generating costs, though it doesn’t necessarily indicate the resource was deleted. |
| Period_from | The start date of the reporting period for which the resource usage is calculated. This reflects the selected date range, not when the resource was created. |
| Period_to | The end date of the reporting period for which the resource usage is calculated. This reflects the selected date range, not when the resource was stopped or deleted. |
| Units | The consumption measurement unit. It can be represented as the usage time, such as gbminutes, minutes, milliseconds (MLS), or as the number of consumed resources, measured in bytes or GBS. |
| Value | The numerical measurement of resource usage. |
| Error | Any errors associated with the costs incurred during the specified period. |
| Cost | Cost of the resource for the specified period. |
| Currency | The type of currency in which the cost is calculated. |
| Attached_to | A Cloud product to which the resource has been connected. For example, it can be an ID of a Virtual Machine that the volume has been attached to. |
| Port_id | A unique identifier for a network virtual port of a VM. It’s used to associate IP addresses and traffic with specific network connections. |
Reservation Cost Report
This report presents monthly information about your prepaid and reserved resources. Unlike the Cost Report, this report accounts for your active resource commitments and shows:- How much of your committed resources you’ve consumed
- Whether you’ve fully utilized your commits
- Any overcommit costs incurred when usage exceeded the reserved amount
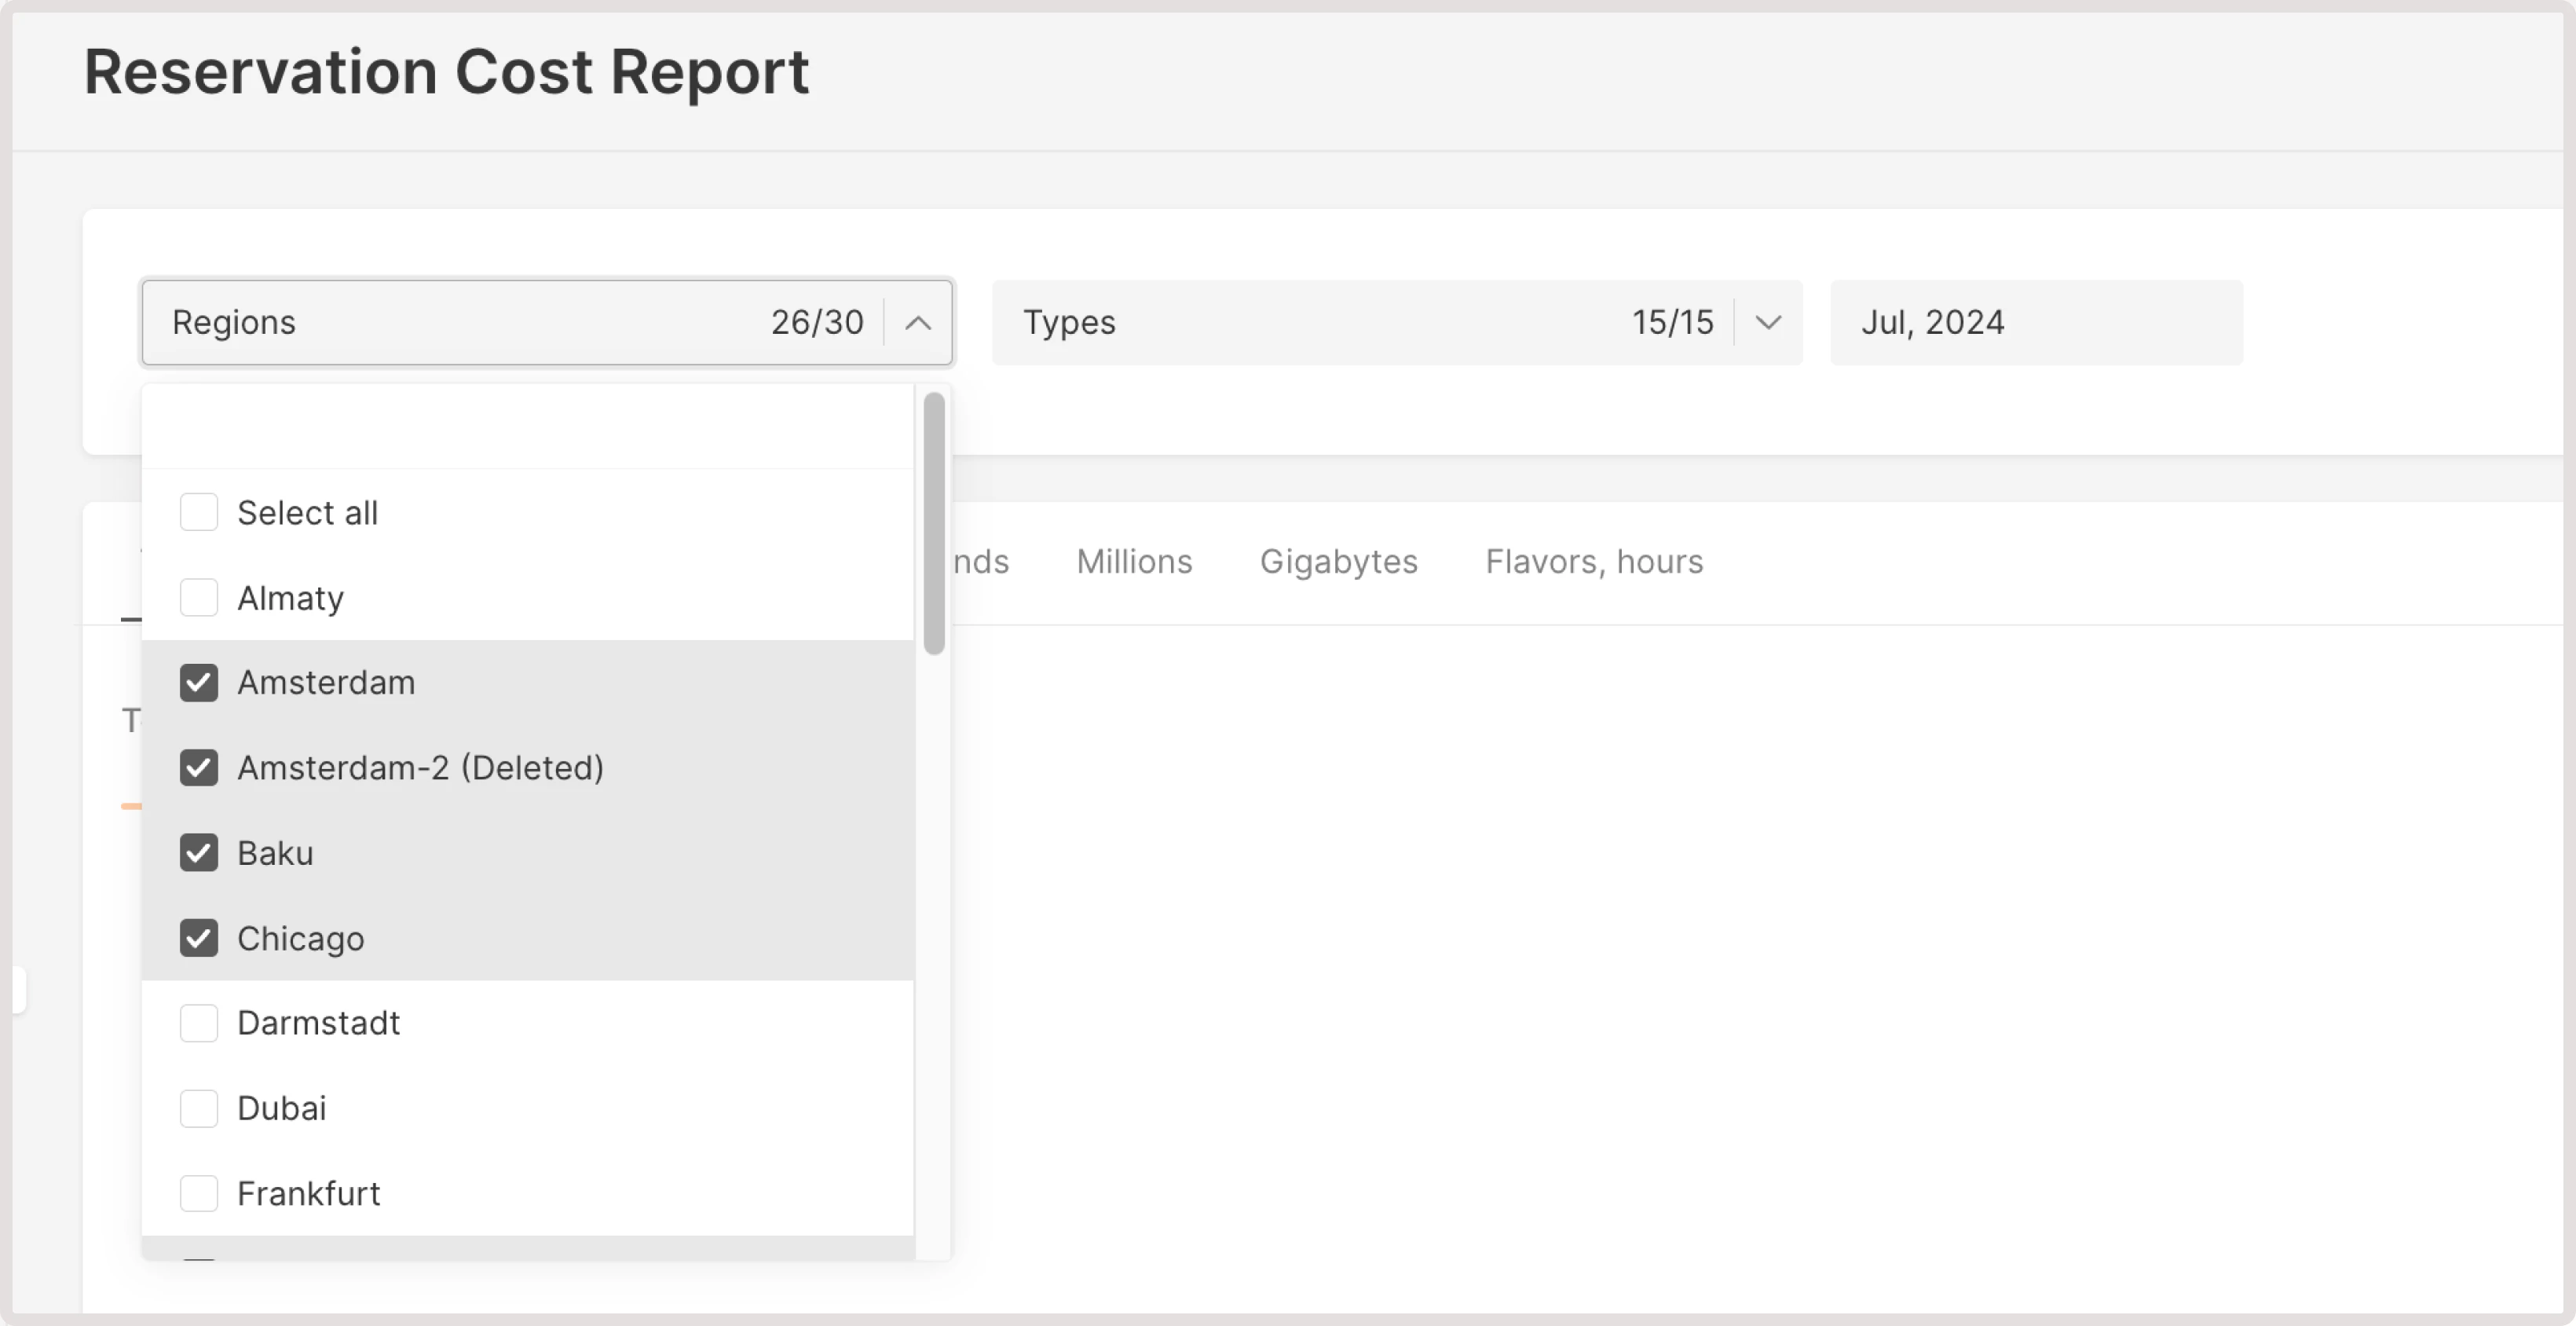
- Region : Check costs for products created in all regions or just the selected ones.
- Resource type : View costs for the selected resource types.
- Consumption period : View costs for a particular month.
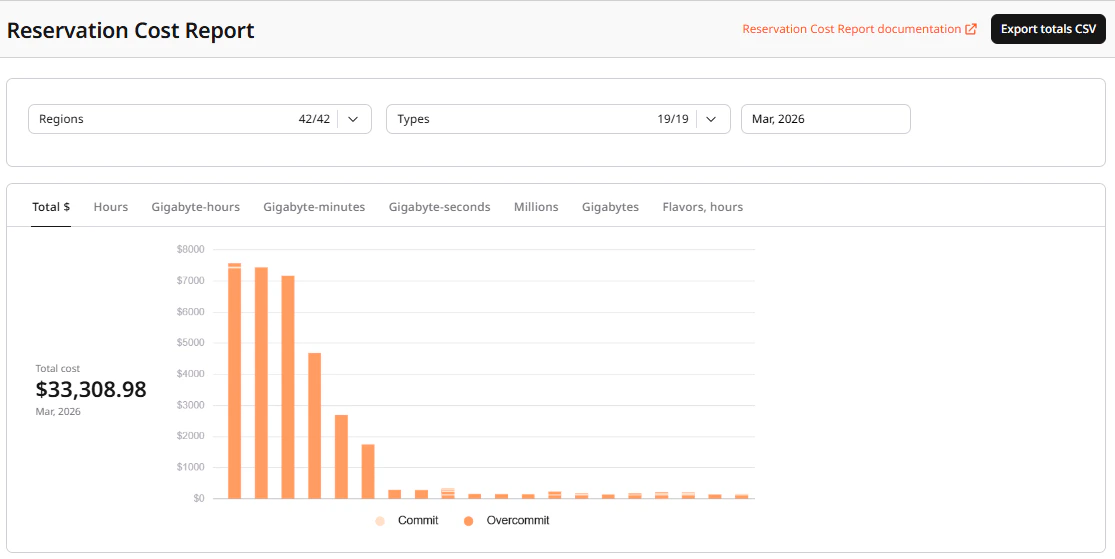
- Total €
- Hours
- GB Minutes
- Gigabyte-seconds
- Millions
- Gigabytes
- Flavors, hours
- Commit usage
- Resource type
- Region
- Commit: the number of reserved resources (active commitments)
- Usage
- Commit cost: fixed monthly costs for resources according to your plan.
- Overcommit cost: costs for overuse of resources within your plan.
- Total cost
Download Reservation Cost Report data
To export the billing report for the selected period, click Export totals CSV in the top-right corner of the screen.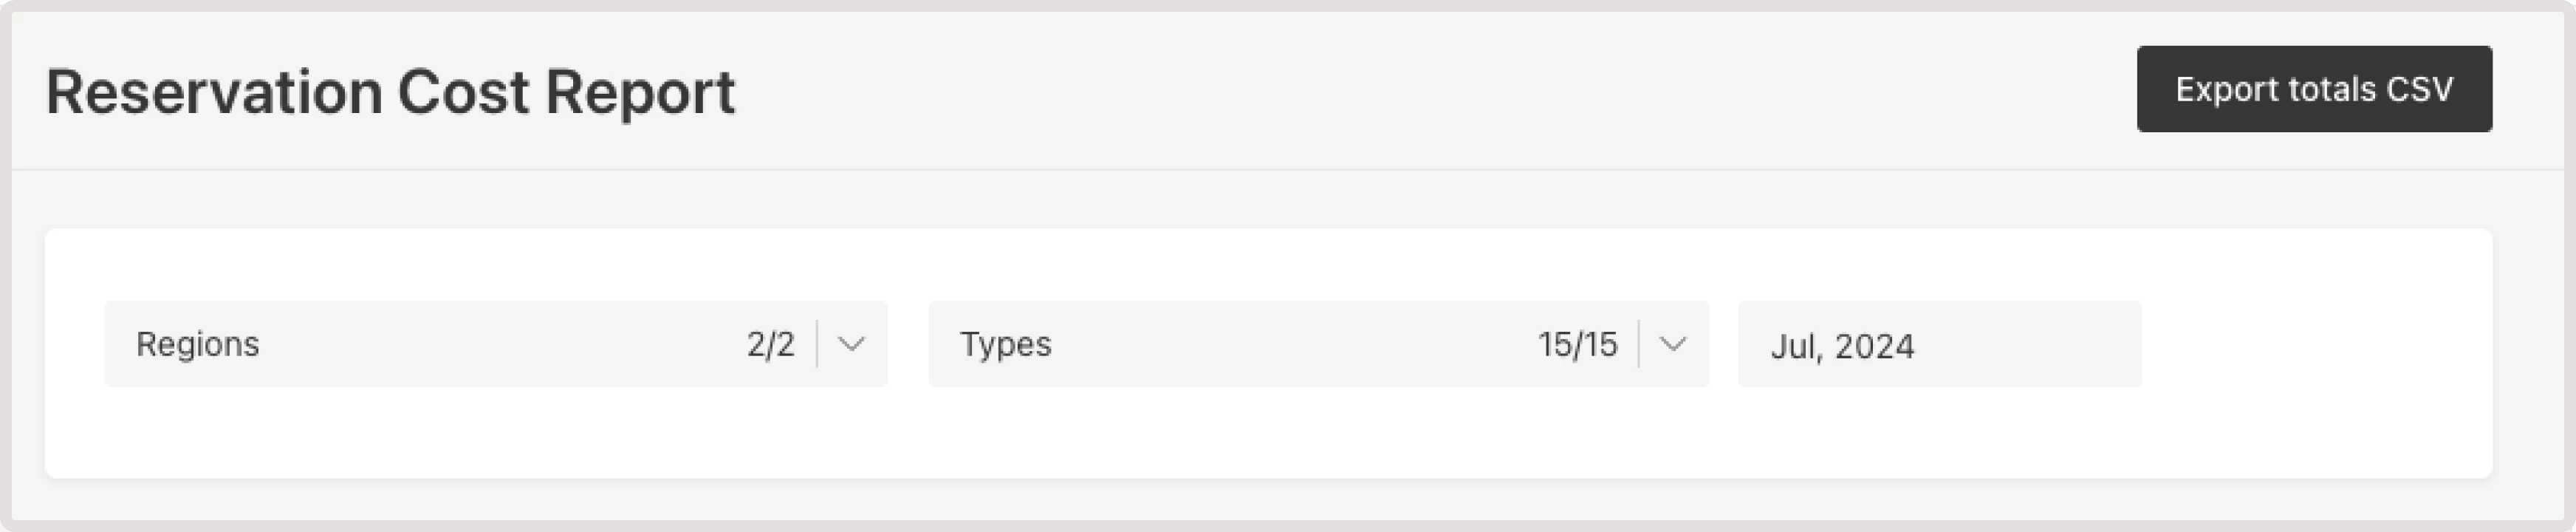
| Column | Description |
|---|---|
| Type | The Cloud resource that you’ve reserved for usage. |
| Feature | Billing identifier of a billable resource that combines the resource type, configuration, region, and pricing model. Every resource has a feature value, even resources with a single configuration like IP addresses. |
| Region_id | ID of a region where the resource has been reserved. You can check the ID via API. |
| Region_name | Name of a geographical location of the data center where the resource has been reserved. |
| Period | The timeframe for the displayed statistics. |
| Units | The unit in which your resources are measured. It can be represented as the usage time, such as gbminutes, minutes, milliseconds (MLS), or as the number of consumed resources, measured in bytes or GBS. |
| Value | Total consumed value. |
| Commit value | Total amount of resources that have been reserved. |
| Commit cost | The cost for a reserved amount of cloud resources. |
| Overcommit cost | Additional charges incurred after the resource usage exceeded the committed (reserved) amount. |
| Error | Any errors associated with the costs incurred during the specified period. |
| Currency | The type of currency in which the cost is calculated. |