If you manage GPU-intensive workloads with fluctuating traffic in a Kubernetes cluster, you can configure the Kubernetes Event-Driven Autoscaling (KEDA) component to automatically scale your GPU resources based on real-time demand.
With such a setup, you’ll ensure optimal performance and cost efficiency of your application.
Gcore Managed Kubernetes includes native autoscaling based on CPU and memory only. To scale your workloads based on GPU utilization, you must manually install and configure KEDA. Step 1. Create a Kubernetes cluster
Add a new Managed Kubernetes cluster with a Bare Metal worker pool:
-
In the Gcore Customer Portal, navigate to Cloud > Kubernetes.
-
Click Create Cluster.
-
Select a region—the location of the data center where your cluster will be deployed.
-
Select the Kubernetes cluster version: v.1.28.6 or higher.
-
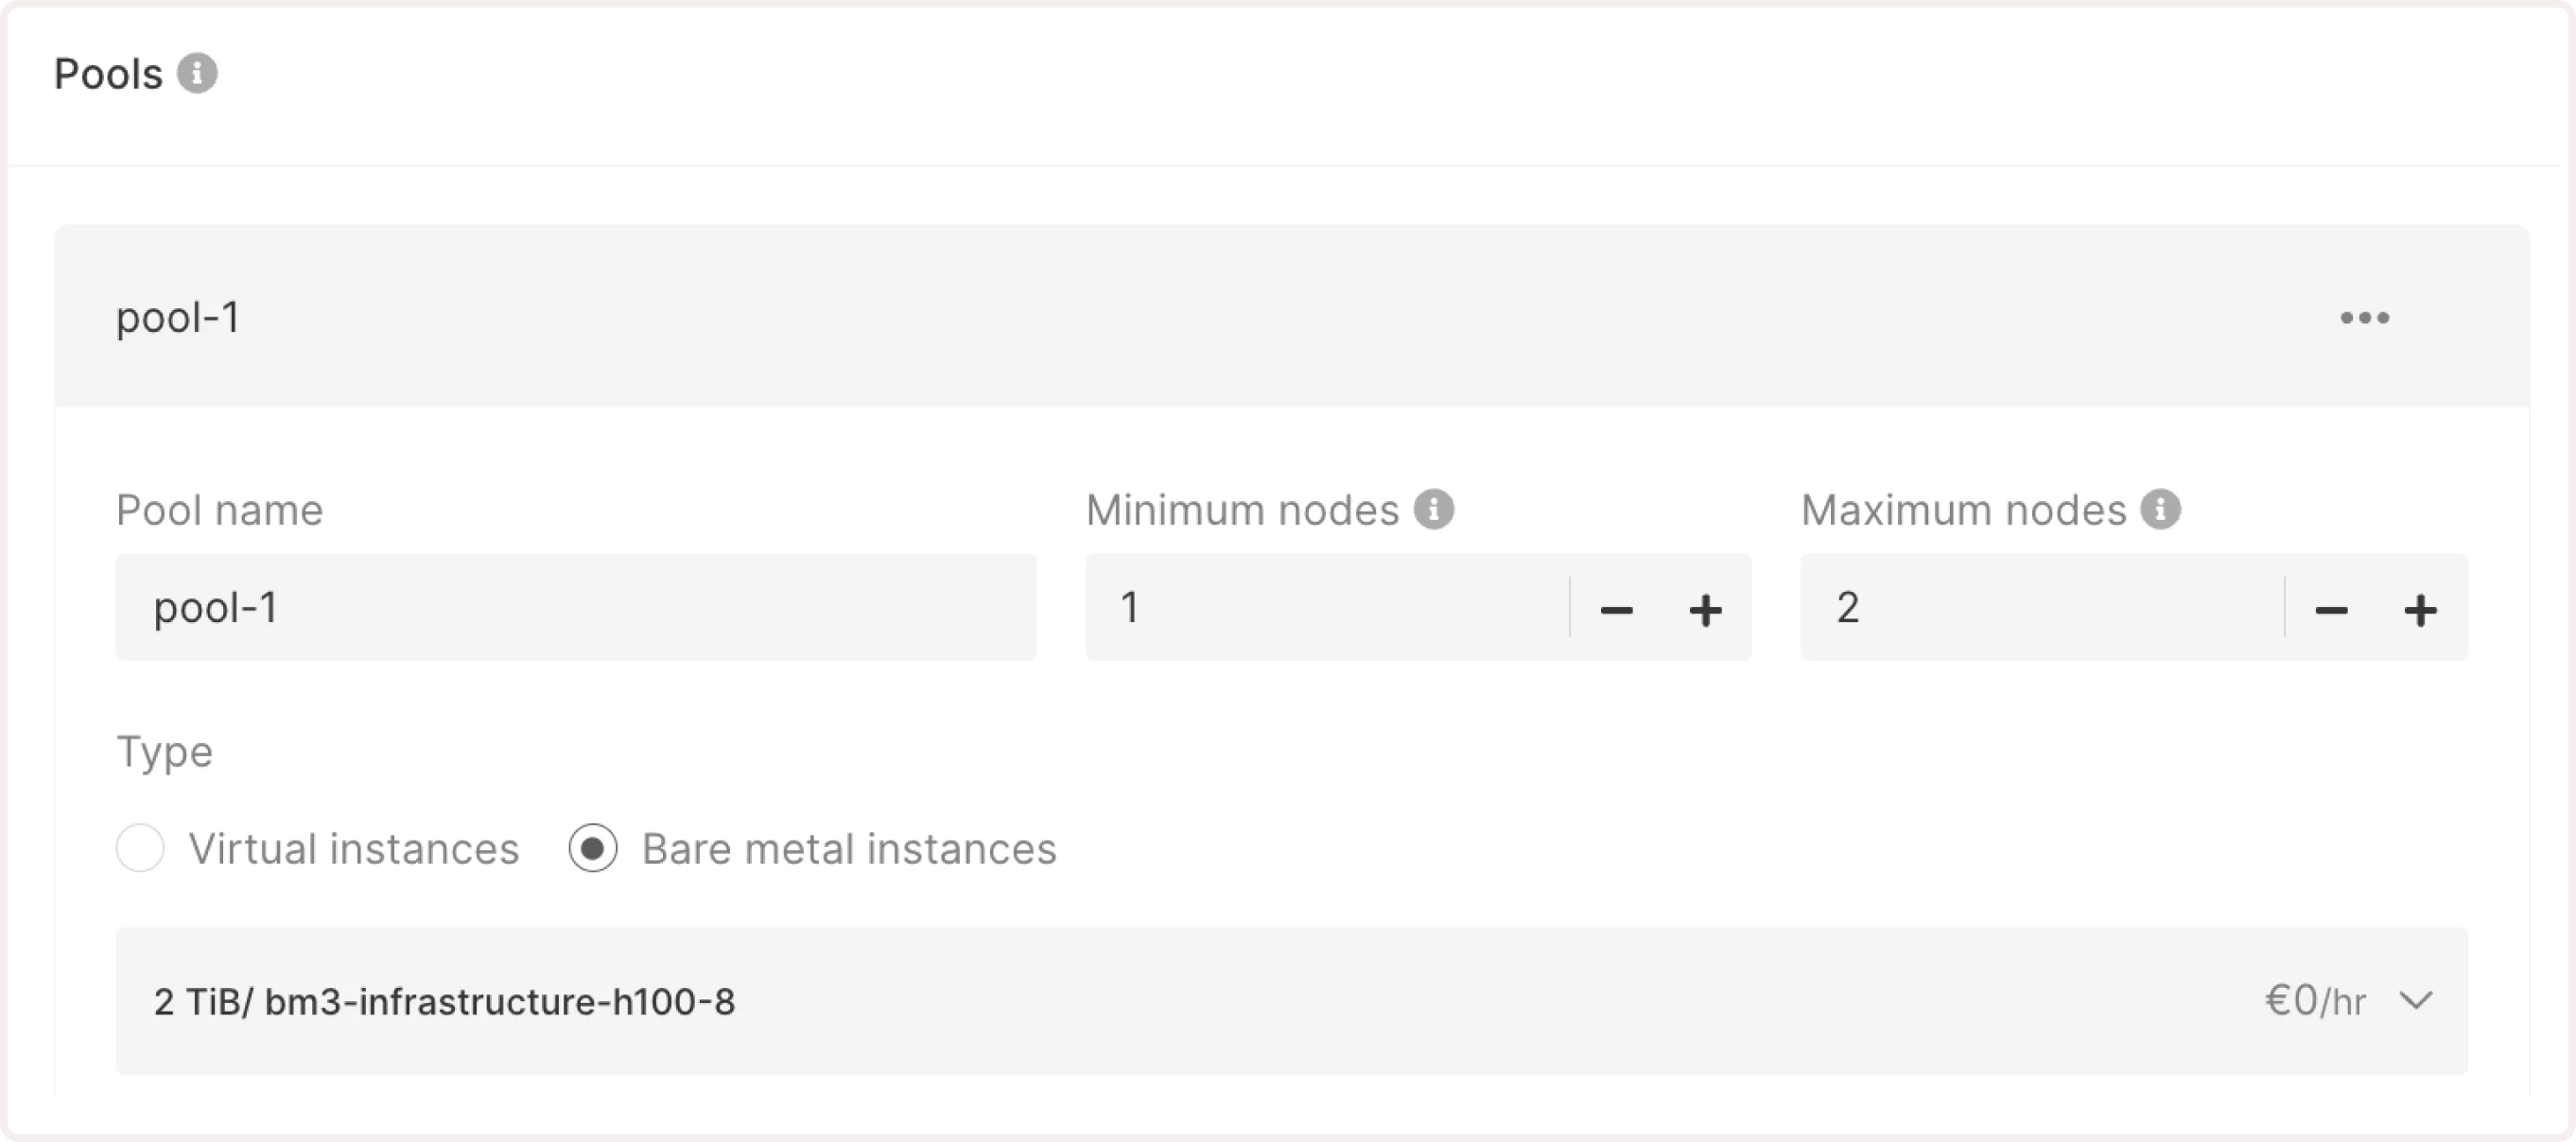
Configure Bare Metal pools:
- Pool name : Enter a unique and descriptive name for your resource pool.
- Minimum nodes and Maximum nodes : Specify how many nodes can be allocated to the pool during traffic fluctuations. The maximum number of pods must be greater than the minimum, allowing the system to scale up in response to increased demand.
- Type : Choose Bare Metal instances.
- Infrastructure : Select the needed GPU-optimized flavor. You need to add at least one node with GPU support to the worker pool.
-
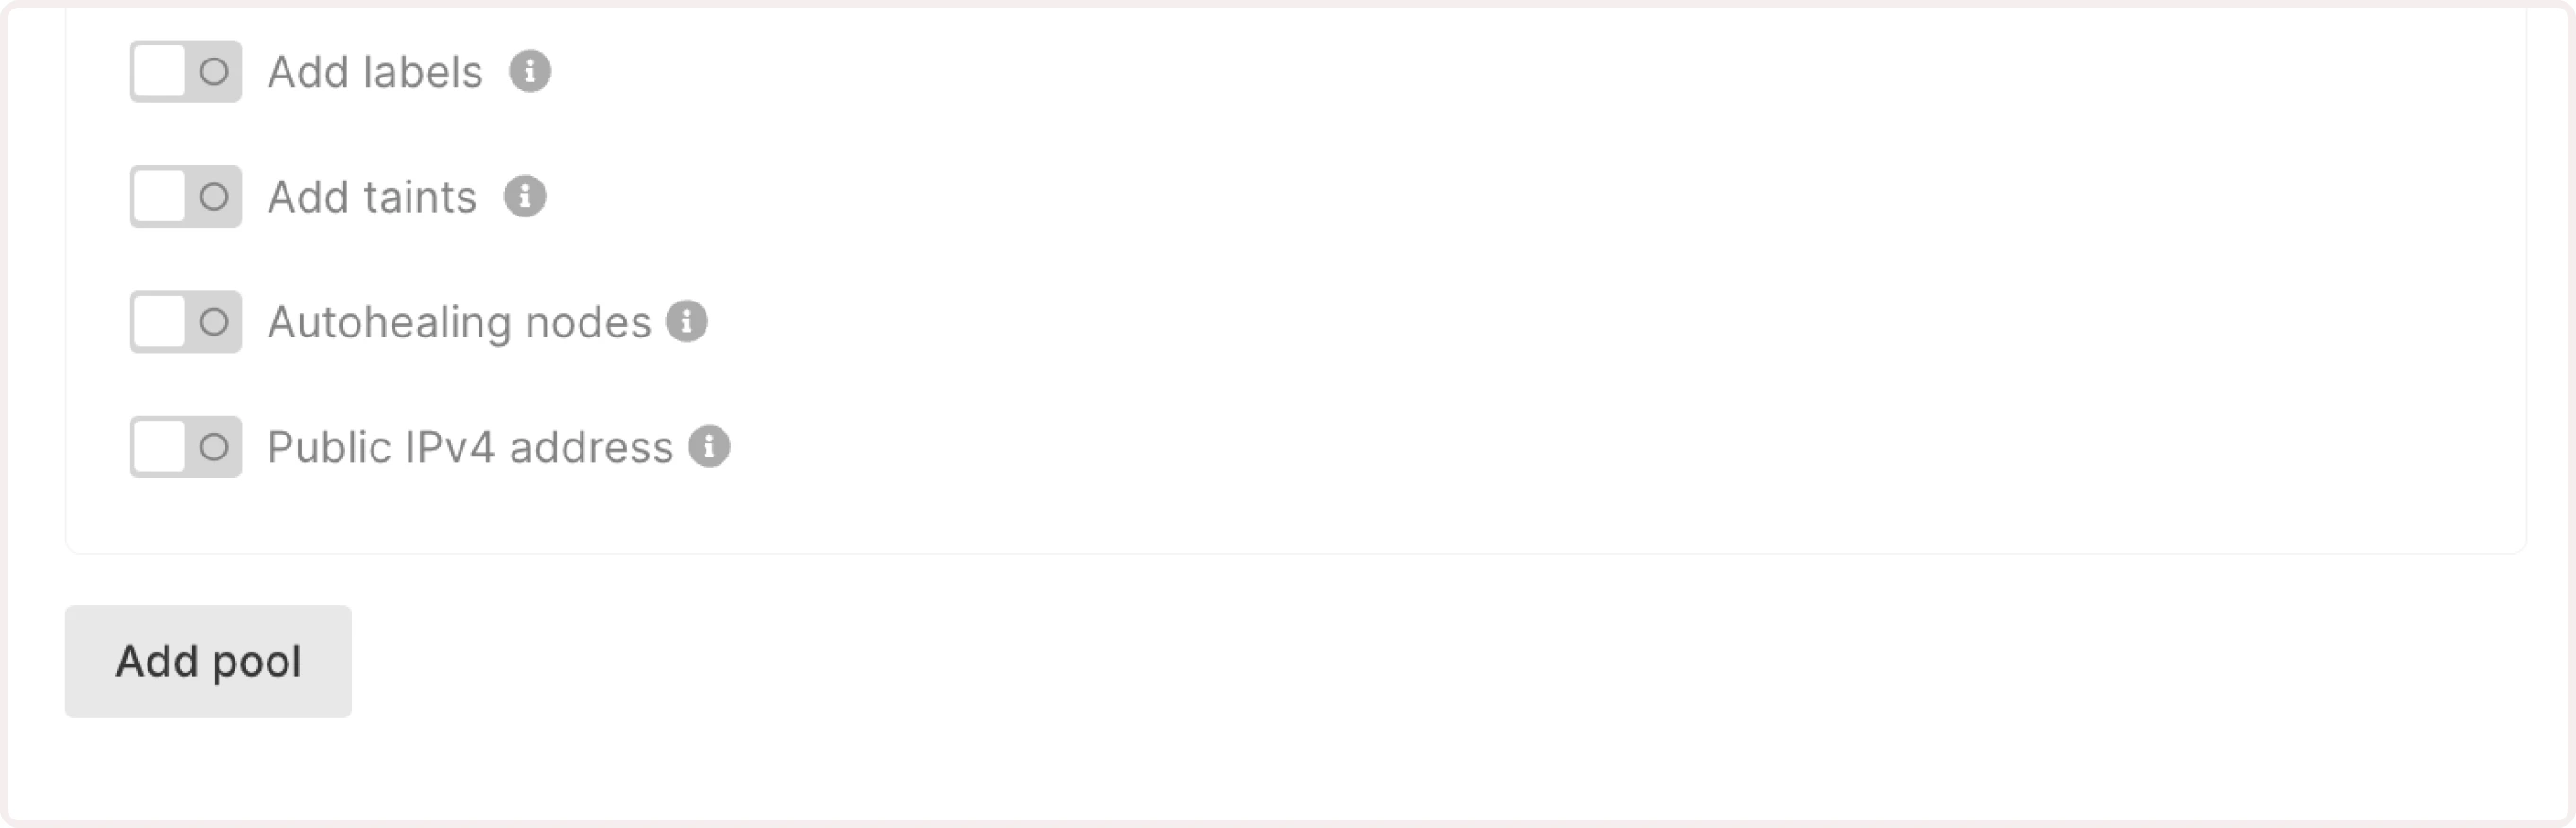
(Optional) Add labels to include additional information about your nodes. You can also specify taints, which are special conditions that define which Kubernetes pods can run on these nodes.
-
Disable the Autohealing nodes toggle.
-
(Optional) Enable the Public IPv4 address option to assign public IPv4 addresses to cluster nodes.
-
If you need to add more pools, click Add pool and configure it according to the previous steps.
- Continue configuring the cluster by following the instructions from Step 5: Select the CNI provider in the Create a Kubernetes cluster guide.
Step 2. Verify your Kubernetes configuration
-
In the Gcore Customer Portal, navigate to Cloud > Kubernetes.
-
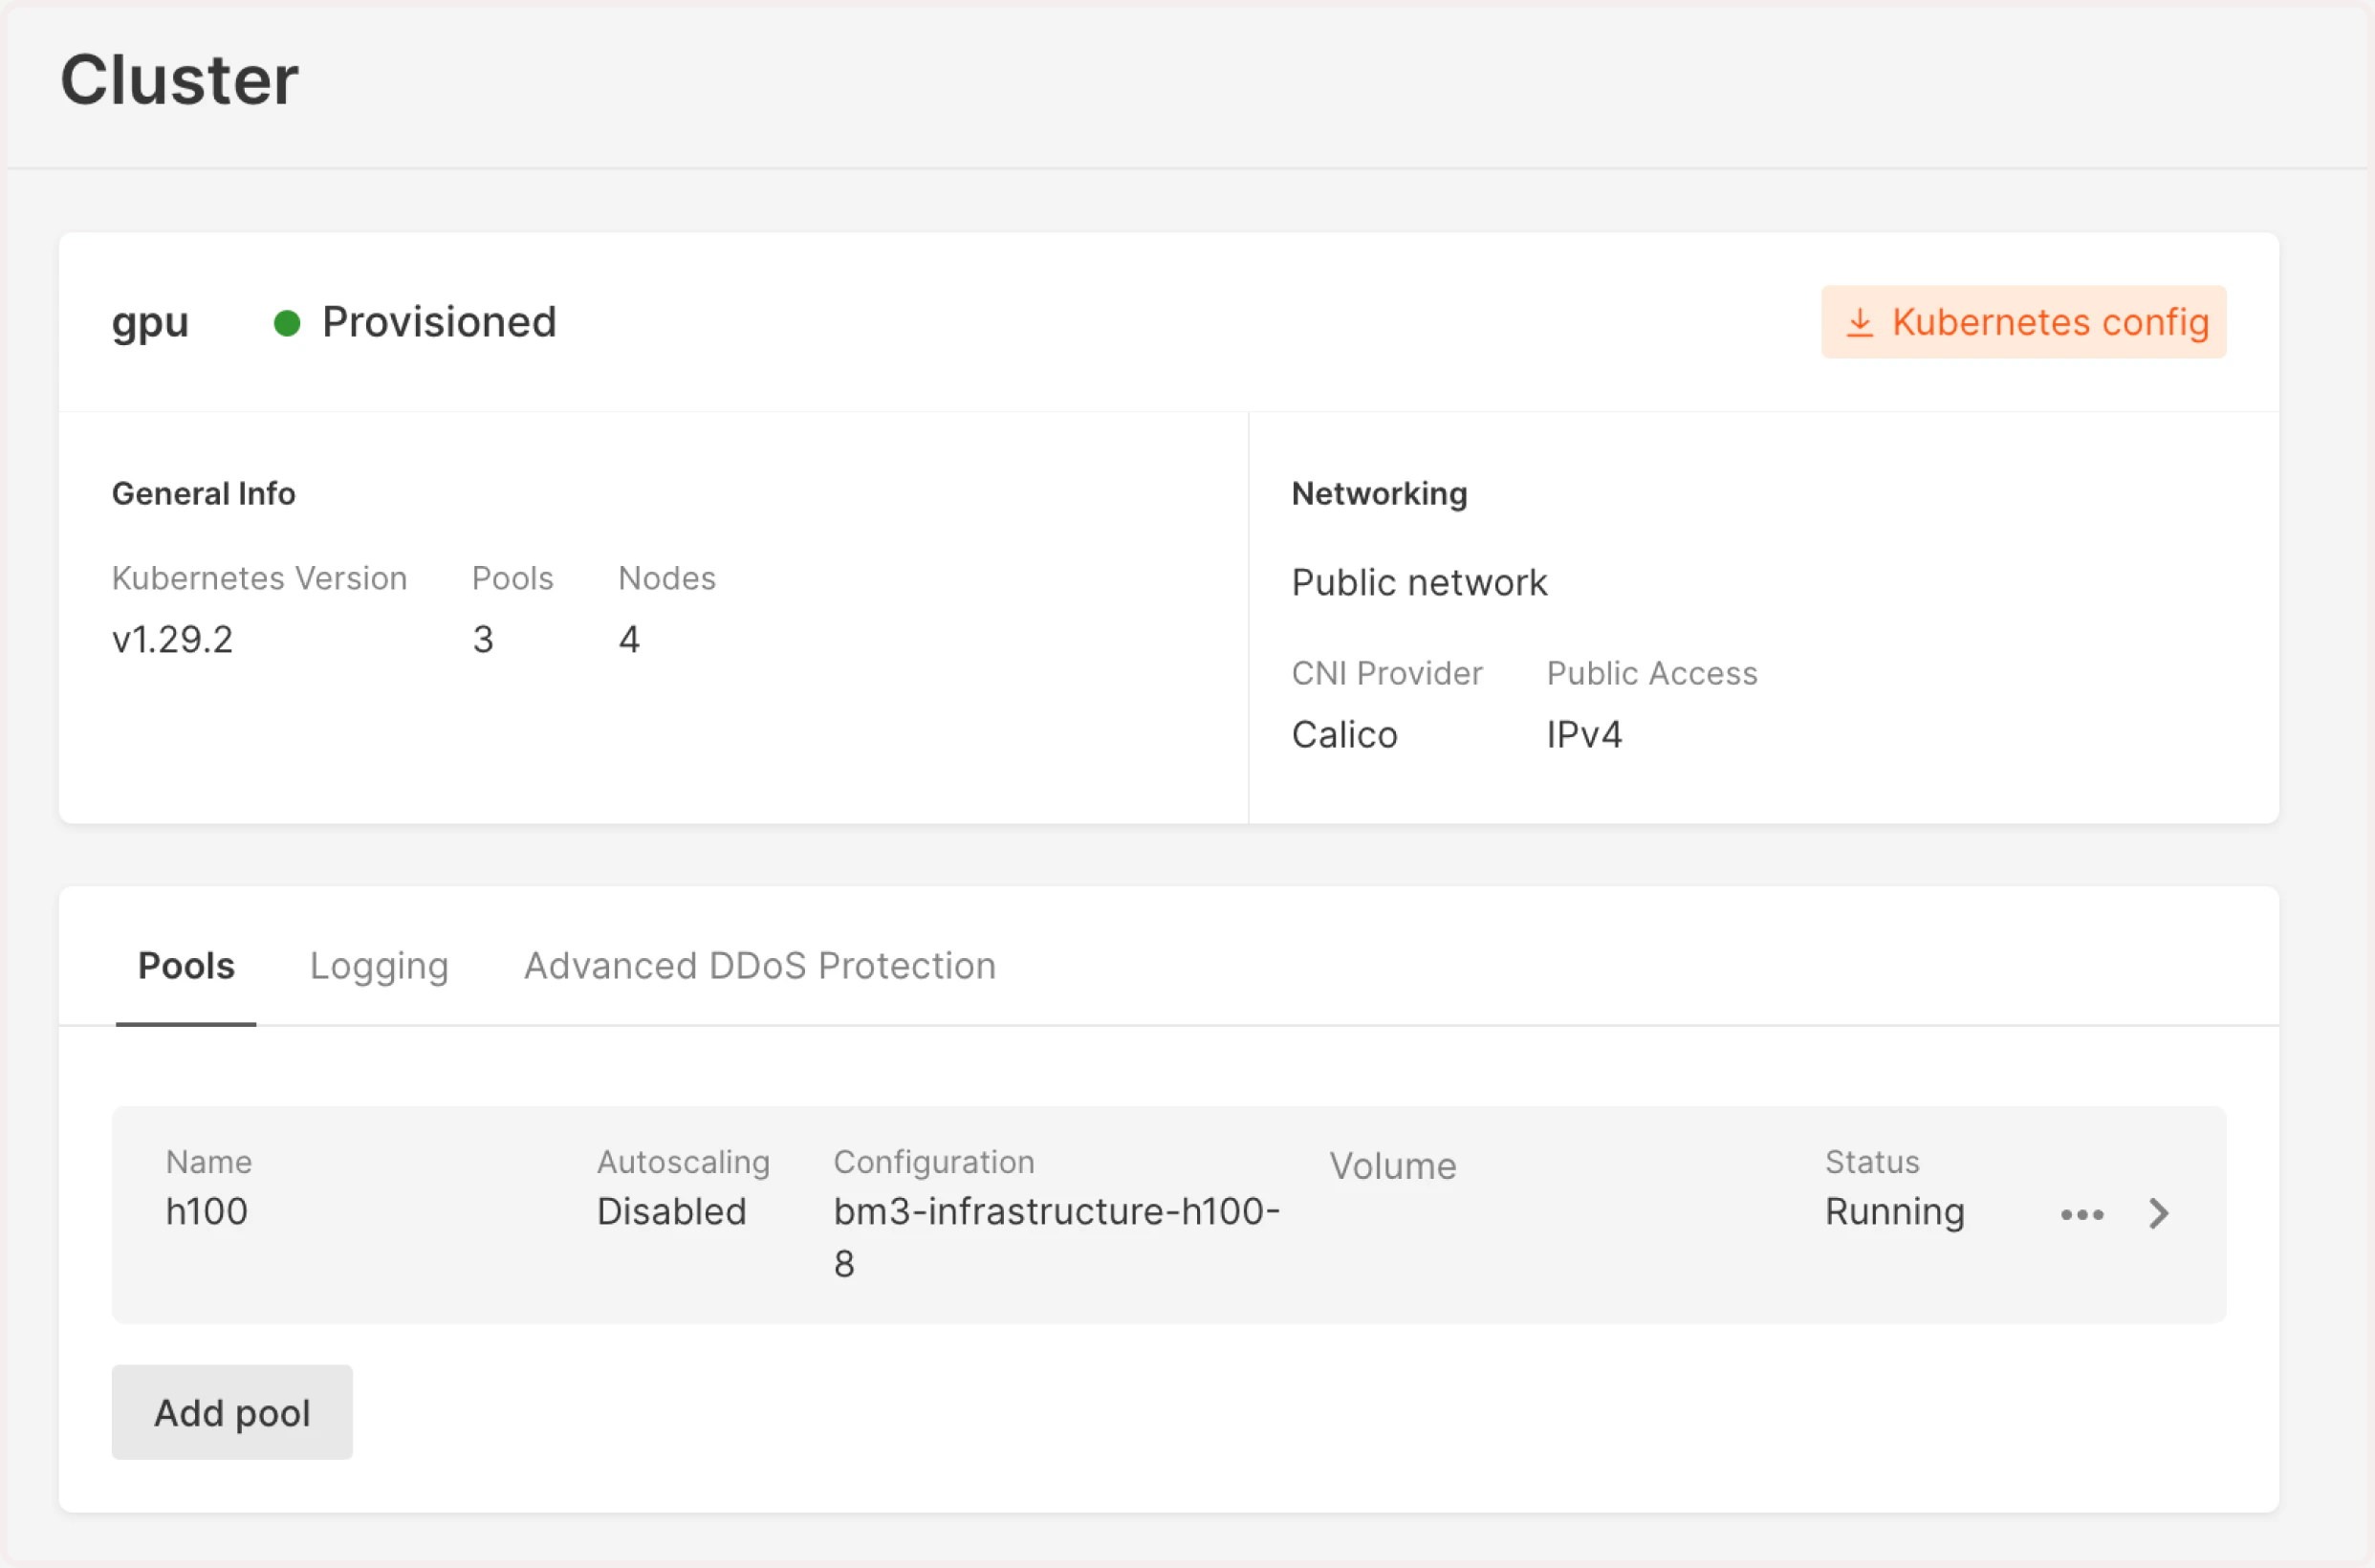
Find the cluster you’ve created in the previous step and click its name to open it.
-
Check the pool status—it should be Running. If you see Scaling up, wait until all resources are allocated and the cluster is ready to use.
-
Download the .config file by clicking Kubernetes config in the top-right corner of the screen.
- Export Kubernetes configuration locally:
export KUBECONFIG=/path/to/your/k8sConfig.yml
- Verify that the created node is ready and correctly configured by running the following command:
Here’s an example of the expected result:
NAME                STATUS   ROLES    AGE     VERSION
ed-b16-82-160-248   Ready    <none>   3h26m   v1.28.6
Step 3. Install GPU Operator
Use Helm package manager to install the GPU Operator that’ll manage your resources. If you don’t have Helm, install it according to the official instructions.
To install the GPU Operator:
- Add the NVIDIA Helm repository and update it as follows:
helm repo add nvidia https://helm.ngc.nvidia.com/nvidia && helm repo update
- Install the GPU Operator with the required configurations for your Kubernetes version:
    helm install gpu-operator nvidia/gpu-operator --version v23.9.1  --wait \
        -n gpu-operator --create-namespace \
        --set driver.enabled=false \
        --set operator.defaultRuntime=crio \
        --set operator.logging.level=debug
    helm install gpu-operator nvidia/gpu-operator --version v23.9.2  --wait \
        -n gpu-operator --create-namespace \
        --set driver.enabled=false \
        --set operator.defaultRuntime=crio \
        --set operator.logging.level=debug
Step 4. Verify GPU allocation
- Verify that GPUs have been allocated correctly. The number of GPU nodes in
nvidia.com/gpu should comply with the number specified in the Bare Metal flavor.
Allocatable:
  cpu:                192
  ephemeral-storage:  850152999143
  hugepages-1Gi:      0
  hugepages-2Mi:      0
  memory:             2113338172Ki
  nvidia.com/gpu:     8
  pods:               110
- Check the status of the Kubernetes pods–it should be READY.
kubectl get pods -n gpu-operator
NAME                                                         READY   STATUS      RESTARTS   AGE
gpu-feature-discovery-f4knk                                  1/1     Running     0          3m9s
gpu-operator-f7ffcf7f8-sf8m7                                 1/1     Running     0          3m34s
gpu-operator-node-feature-discovery-gc-7cc7ccfff8-77g45      1/1     Running     0          3m34s
gpu-operator-node-feature-discovery-master-d8597d549-dnxz5   1/1     Running     0          3m34s
gpu-operator-node-feature-discovery-worker-rlf6p             1/1     Running     0          3m34s
nvidia-container-toolkit-daemonset-rl9p2                     1/1     Running     0          3m1s
nvidia-cuda-validator-78g72                                  0/1     Completed   0          2m32s
nvidia-dcgm-exporter-nv9bk                                   1/1     Running     0          3m9s
nvidia-device-plugin-daemonset-4l5fl                         1/1     Running     0          3m9s
nvidia-mig-manager-rqnsq                                     1/1     Running     0          26s
nvidia-operator-validator-n9rpz                              1/1     Running     0          3m9s
Step 5. Run test CUDA pod
Run a test GPU application to verify that the GPU resources in your Kubernetes cluster are properly configured and accessible. Follow the instructions from the official NVIDIA guide: Verification: running sample GPU application.
Step 6. Install KEDA for GPU autoscaling
Install and configure the Kubernetes Event-Driven Autoscaling (KEDA) component for your Managed Kubernetes cluster.
- Add the KEDA Helm repository:
helm repo add kedacore https://kedacore.github.io/charts
- Update the repository to include any new Helm charts:
- Install KEDA into its own namespace:
helm install keda kedacore/keda --namespace keda --create-namespace
Step 7. Install kube-prometheus-stack
To collect and visualize metrics from your Kubernetes cluster, install the kube-prometheus-stack integrated with Prometheus and Grafana.
-
Add the Prometheus Helm repository:
helm repo add prometheus-community https://prometheus-community.github.io/helm-charts
-
Update the repository:
helm repo update
-
Inspect the default values for the kube-prometheus-stack:
helm inspect values prometheus-community/kube-prometheus-stack > values.yaml
-
Create the values-overrides.yaml file that contains additional configurations for the GPU operator:
serviceMonitorSelectorNilUsesHelmValues: false

additionalScrapeConfigs:
- job_name: gpu-metrics
  scrape_interval: 1s
  metrics_path: /metrics
  scheme: http
  kubernetes_sd_configs:
  - role: endpoints
    namespaces:
      names:
      - gpu-operator
  relabel_configs:
  - source_labels: [__meta_kubernetes_endpoints_name]
    action: drop
    regex: .*-node-feature-discovery-master
  - source_labels: [__meta_kubernetes_pod_node_name]
    action: replace
    target_label: kubernetes_node
- Install kube-prometheus-stack with the specified configurations:
helm install prometheus-community/kube-prometheus-stack \
   --create-namespace --namespace prometheus \
   --generate-name \
   -f values.yaml -f values-overrides.yaml
job that scrapes DCGM metrics from the gpu-operator namespace.
Step 8. Create autoscaling configuration
Define your GPU workload and configure autoscaling using KEDA with Prometheus-based GPU utilization metrics.
Here is an example configuration:
apiVersion: apps/v1
kind: Deployment
metadata:
  name: <span style="color:#FF5913">workload-name</span>
spec:
  replicas: 1
  selector:
    matchLabels:
      app: gpu
  template:
    metadata:
      labels:
        app: gpu
    spec:
      containers:
        - name: <span style="color:#FF5913">workload-name</span>
          image: <span style="color:#FF5913">app-URL</span>
          command: <span style="color:#FF5913">["--argument-1", "-argument-2"]</span>
          args: <span style="color:#FF5913">app-URL</span>
          resources:
            limits:
              nvidia.com/gpu: <span style="color:#FF5913">allocated-number-of-GPUs</span>
---
apiVersion: keda.sh/v1alpha1
kind: ScaledObject
metadata:
  name: gpu-dcgmproftester-deployment-scaledobject
spec:
  scaleTargetRef:
    name: <span style="color:#FF5913">workload-name</span>
  minReplicaCount: <span style="color:#FF5913">number-of-replicas</span>
  maxReplicaCount: <span style="color:#FF5913">number-of-replicas</span>
  triggers:
  - type: prometheus
    metadata:
      serverAddress: http://prometheus-operated.prometheus:9090
      metricName: <span style="color:#FF5913">metrics-name</span>
      threshold: "<span style="color:#FF5913">threshold-number</span>"
      query: sum(avg_over_time(DCGM_FI_DEV_GPU_UTIL{pod=~"<span style="color:#FF5913">workload-name</span>.*"}[30s])) # <- HPA will divide it for number of replicas due to AVG strategy
DCGM_FI_DEV_GPU_UTIL represents the real-time utilization of GPU cores. This is collected by the nvidia-dcgm-exporter, which is part of the GPU Operator setup.
You may adjust the query expression or choose other metrics depending on your use case.
TipThis autoscaling configuration is based on the DCGM_FI_DEV_GPU_UTIL metrics (GPU utilization). However, you can use any of available metric from DCGM exporter.
- workload-name: Enter a unique name that identifies your workload. Make sure that you use the same value in all name fields.
- app-URL: Specify the location of your application. For example, a Docker image.
- allocated-number-of-GPUs: Specify how many GPUs you need. For example, 8.
- [“/usr/bin/sample-command”]: Enter the command your container should run at startup.
- [“—argument-1”, “-argument-2”]: Provide any arguments that should be passed to the command.
- number-of-replicas: Provide the minimum and maximum number of workload copies the system will create during traffic fluctuation.
- metrics-name: Enter a unique-phrase-that-distinguishes-your-metrics
- threshold-number: If the number is reached, the system creates a new workload. For instance, “60”.
Step 9. Check the results
After an application with the GPU workload is deployed, Keda creates a Horizontal Pod Autoscaler (HPA) for this workload and injects the value of GPU utilization from Prometheus as an external metric.
- To get real-time information about the HPA, run
k get hpa -w.
You should get an output like this:
NAME                                                  REFERENCE                                  TARGETS              MINPODS   MAXPODS   REPLICAS   AGE
keda-hpa-gpu-dcgmproftester-deployment-scaledobject   Deployment/gpu-dcgmproftester-deployment   <unknown>/60 (avg)   1         16        0          0s
keda-hpa-gpu-dcgmproftester-deployment-scaledobject   Deployment/gpu-dcgmproftester-deployment   0/60 (avg)           1         16        1          16s
keda-hpa-gpu-dcgmproftester-deployment-scaledobject   Deployment/gpu-dcgmproftester-deployment   23/60 (avg)          1         16        1          76s
....
keda-hpa-gpu-dcgmproftester-deployment-scaledobject   Deployment/gpu-dcgmproftester-deployment   67750m/60 (avg)      1         16        8          10m
- Fetch the events:
k get events -w.
You should get an output like this:
....
0s          Warning   FailedScheduling      pod/gpu-dcgmproftester-deployment-9f866ff47-dnzns                             0/1 nodes are available: 1 Insufficient nvidia.com/gpu. preemption: 0/1 nodes are available: 1 No preemption victims found for incoming pod..

....
kube-system    69s         Normal    ScaledUpGroup         configmap/cluster-autoscaler-status                                           Scale-up: setting group MachineDeployment/76-320426/gpu-autoscale-h100-h100-machine-deployment size to 2 instead of 1 (max: 2)
kube-system    69s         Normal    ScaledUpGroup         configmap/cluster-autoscaler-status                                           Scale-up: group MachineDeployment/76-320426/gpu-autoscale-h100-h100-machine-deployment size set to 2 instead of 1 (max: 2)
- Check all pods within your cluster:
k get pods.
You should see something like this:
NAME                                            READY   STATUS    RESTARTS   AGE
apiserver-bridge-j7jk6                          1/1     Running   0          141m
gpu-dcgmproftester-deployment-9f866ff47-57zmg   1/1     Running   0          11m
gpu-dcgmproftester-deployment-9f866ff47-5wxxb   1/1     Running   0          15m
gpu-dcgmproftester-deployment-9f866ff47-8gkm8   1/1     Running   0          14m
gpu-dcgmproftester-deployment-9f866ff47-9t4bv   1/1     Running   0          7m57s
gpu-dcgmproftester-deployment-9f866ff47-dnzns   0/1     Pending   0          6m57s
gpu-dcgmproftester-deployment-9f866ff47-fb5cs   0/1     Pending   0          6m57s
gpu-dcgmproftester-deployment-9f866ff47-qthzr   1/1     Running   0          10m
gpu-dcgmproftester-deployment-9f866ff47-rxm2c   1/1     Running   0          17m
gpu-dcgmproftester-deployment-9f866ff47-tc8pq   1/1     Running   0          8m58s
gpu-dcgmproftester-deployment-9f866ff47-zbt8d   1/1     Running   0          12m
maxReplicaCount in Step 8.
InfoAfter provisioning nodes, it might take up to five minutes for the Nvidia GPU resources to be distributed and managed in the Kubernetes cluster.
- Check the list of nodes and related information:
k get nodes.
You’ll get the list of nodes and their statuses:
NAME                STATUS   ROLES    AGE    VERSION
ed-b16-78-161-160   Ready    <none>   166m   v1.28.6
ed-b16-78-161-169   Ready    <none>   12m    v1.28.6
- Double-check the HPA status:
k get hpa.
You should see something like this:
NAME                                                  REFERENCE                                  TARGETS           MINPODS   MAXPODS   REPLICAS   AGE
keda-hpa-gpu-dcgmproftester-deployment-scaledobject   Deployment/gpu-dcgmproftester-deployment   71463m/60 (avg)   1         16        16         41m
maxReplicaCount limit.
If all GPUs are in use, and there are not enough available resources, Kubernetes will keep the pods in Pending state.
Cluster Autoscaler (enabled by default in Gcore Managed Kubernetes) will then provision new nodes based on resource demand.
Once the new node is ready and GPUs are initialized (which might take 5–10 minutes), the pending pods will start running.