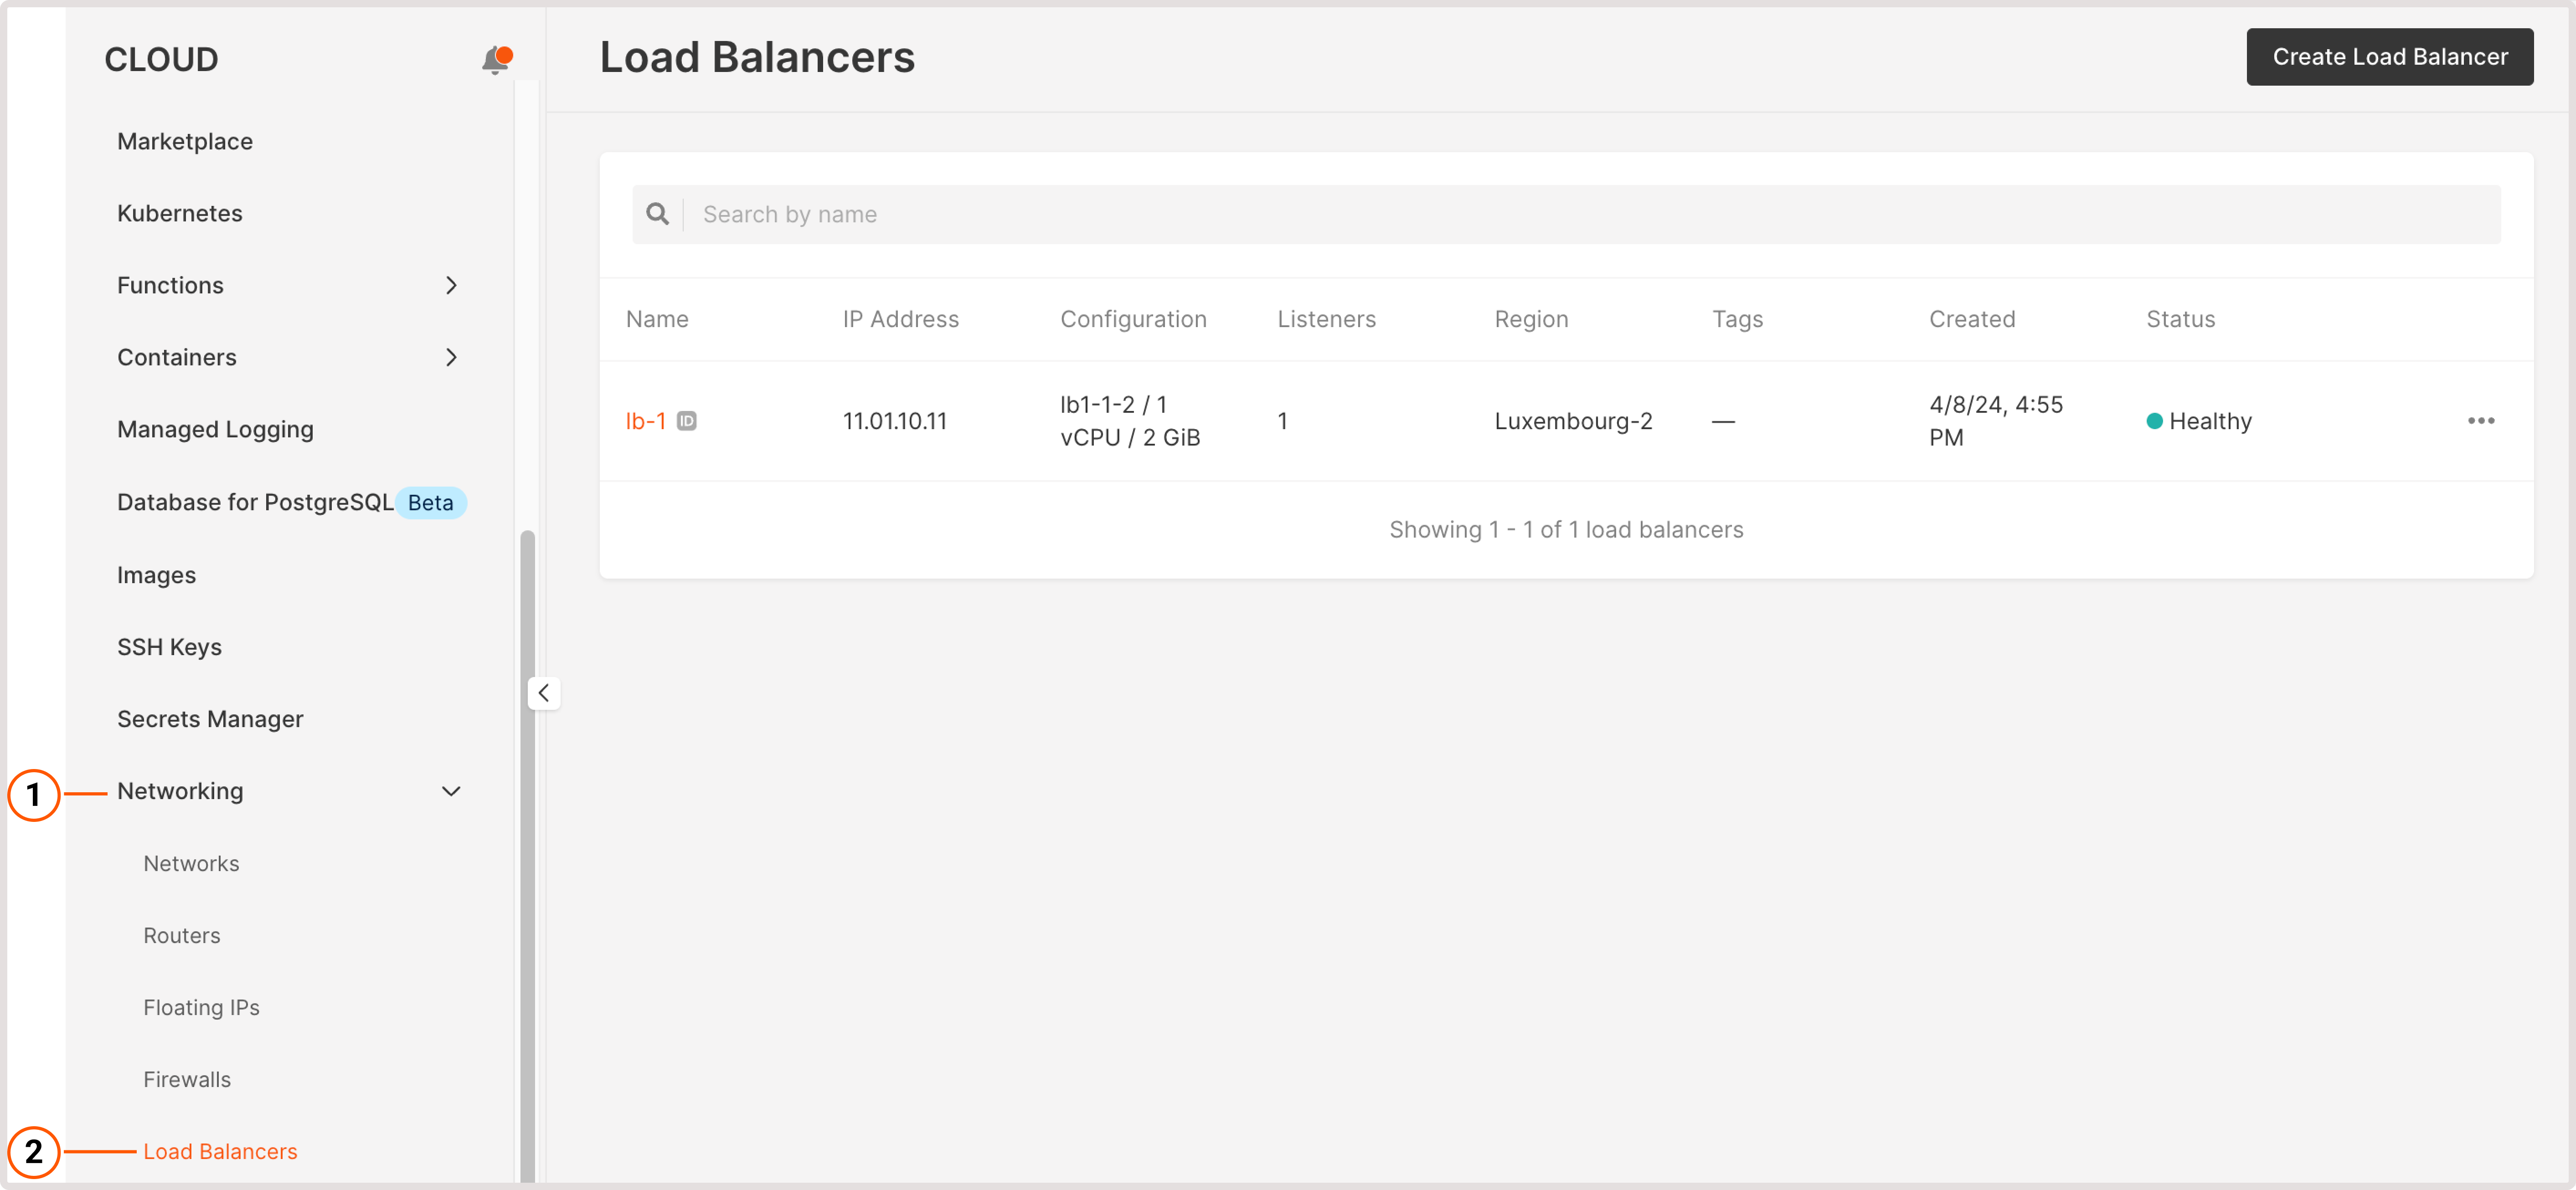
After you create a Load Balancer, it will appear on the Load Balancers page in the Customer Portal. To access the page: 1. Navigate to Cloud > Networking. 2. Open the Load Balancers page.Documentation Index
Fetch the complete documentation index at: https://gcore.com/docs/llms.txt
Use this file to discover all available pages before exploring further.

- Name : The name and brief summary of its configuration.
- IP Address : Address assigned to the Load Balancer.
- Listeners : The number of configured listening ports that define how incoming network traffic is received and distributed.
- Region : The geographical location of a data center where the Load Balancer is deployed.
- Tags : Metadata used to label and categorize Load Balancer within a cloud environment.
- Created : The date and time when it was deployed.
- Operating status, Provisioning status : Check the statuses of Load Balancer and its components for a detailed overview of each one.
Statuses of a load balancers and its components
A Load Balancer and its components (listener, pool, and pool member) can have two types of statuses:- Operating status : The current observed operational state of a resource. The status reflects whether the resource is functioning as expected or if there are any issues with its operation.
- Provisioning status : The lifecycle stage of a resource, from creation through any changes to potential deletion.
- Online : It’s operating normally, and all pool members are healthy.
- Draining : Pool members are no longer accepting new connections.
- Offline : Load Balancer isn’t accepting new connections.
- Degraded : One or more pool members are in an error state.
- Error : This status indicates that the Load Balancer has failed, one or more pool members are failing health checks, or all pool members are in an error state.
- No_monitor : No health monitor is configured for a resource. Thus, its status is unknown.
- Active : It’s been successfully created.
- Deleted : It’s been successfully deleted.
- Updating : It’s currently being updated.
- Deleting : It’s currently being deleted.
- Error : The system failed to create a balancer. If an error occurs during the update or deletion of a balancer, initiate a failover. Load Balancers that fail to be created will be automatically deleted.
InfoUpdating the name, description, or tags of a Load Balancer won’t cause any connection interruptions or downtime.
Load balancer impact on availability
Most operations, such as adding or modifying listeners and pools, do not disrupt active traffic. However, changing the load balancer’s flavor or initiating a failover will terminate existing connections, while all other operations have no effect on active connections. The table below outlines the effect of each operation:| Operation | Impact |
|---|---|
| Adding a listener | No |
| Modifying listener properties | No |
| Adding a pool | No |
| Changing flavor | Terminates connections |
| Initiating failover | Terminates connections |
| Removing a listener | No |
Load balancer settings
You can inspect the configuration details of a created Load Balancer, view and copy its routing scheme, add and remove listeners, or enable logging on the Overview page. To open the page: 1. Navigate to Cloud > Networking. 2. On the Load Balancers page, find the balancer you want to configure and click its name to open the settings.
- Routing scheme : Visualization of traffic flow as it passes through a Load Balancer. The scheme demonstrates what’s happening as traffic is received (ingress) and sent out (egress) by the balancer.
- Type : Network distribution by a Load Balancer—external (public) or private.
- VIPs : Virtual IP address of a Load Balancer.
- Floating IP : If you added a Floating IP while creating a Load Balancer, it will appear in this column.
- Operating status, Provisioning status : Check the statuses of Load Balancer and its components for a detailed overview of each one.
Limits
| Component | Limit |
|---|---|
| Load Balancers | Managed by Quotas |
| Listeners* | 50 (excluding Prometheus) |
| Prometheus Listener* | 1 |
| Pools* | 50 |
| Members* | 2500 |
- Large pools are supported, allowing configurations such as a single pool with 1000–2000 members. The total number of members cannot exceed 2500.
- Pools must be directly attached to either a listener or a Load Balancer, with a maximum of one pool directly connected to each listener.
Flavor
This tab features a summary of the load balancer’s configuration and its resources.
- Flavor : A name for the specific configuration that defines the combination of vCPU and RAM resources allocated for the Load Balancer.
- vCPU : The number of allocated virtual CPU cores.
- RAM : The amount of allocated RAM, expressed in Gibibytes (GiB).
- ID : A unique identifier of the Load Balancer used for management and tracking within the cloud environment.
- Active connections : The number of current, ongoing connections being handled by the load balancer.
- Bytes in : The total amount of data received by the balancer.
- Bytes out : The total amount of data sent out by the balancer.
- Request errors : The number of errors that occurred during the handling of requests.
- Total connections : The total number of connections that have been made to the Load Balancer.
Monitoring
This tab provides an overview of the Load Balancer’s performance metrics that are crucial for tracking its health and performance. By checking the metrics, you can understand if the current resources are sufficient or if there’s a need to scale up and optimize Load Balancer’s performance. Monitoring data is available in hourly and weekly views:- Hourly options: 1, 6, or 24 hours
- Weekly options: 1 or 2 weeks
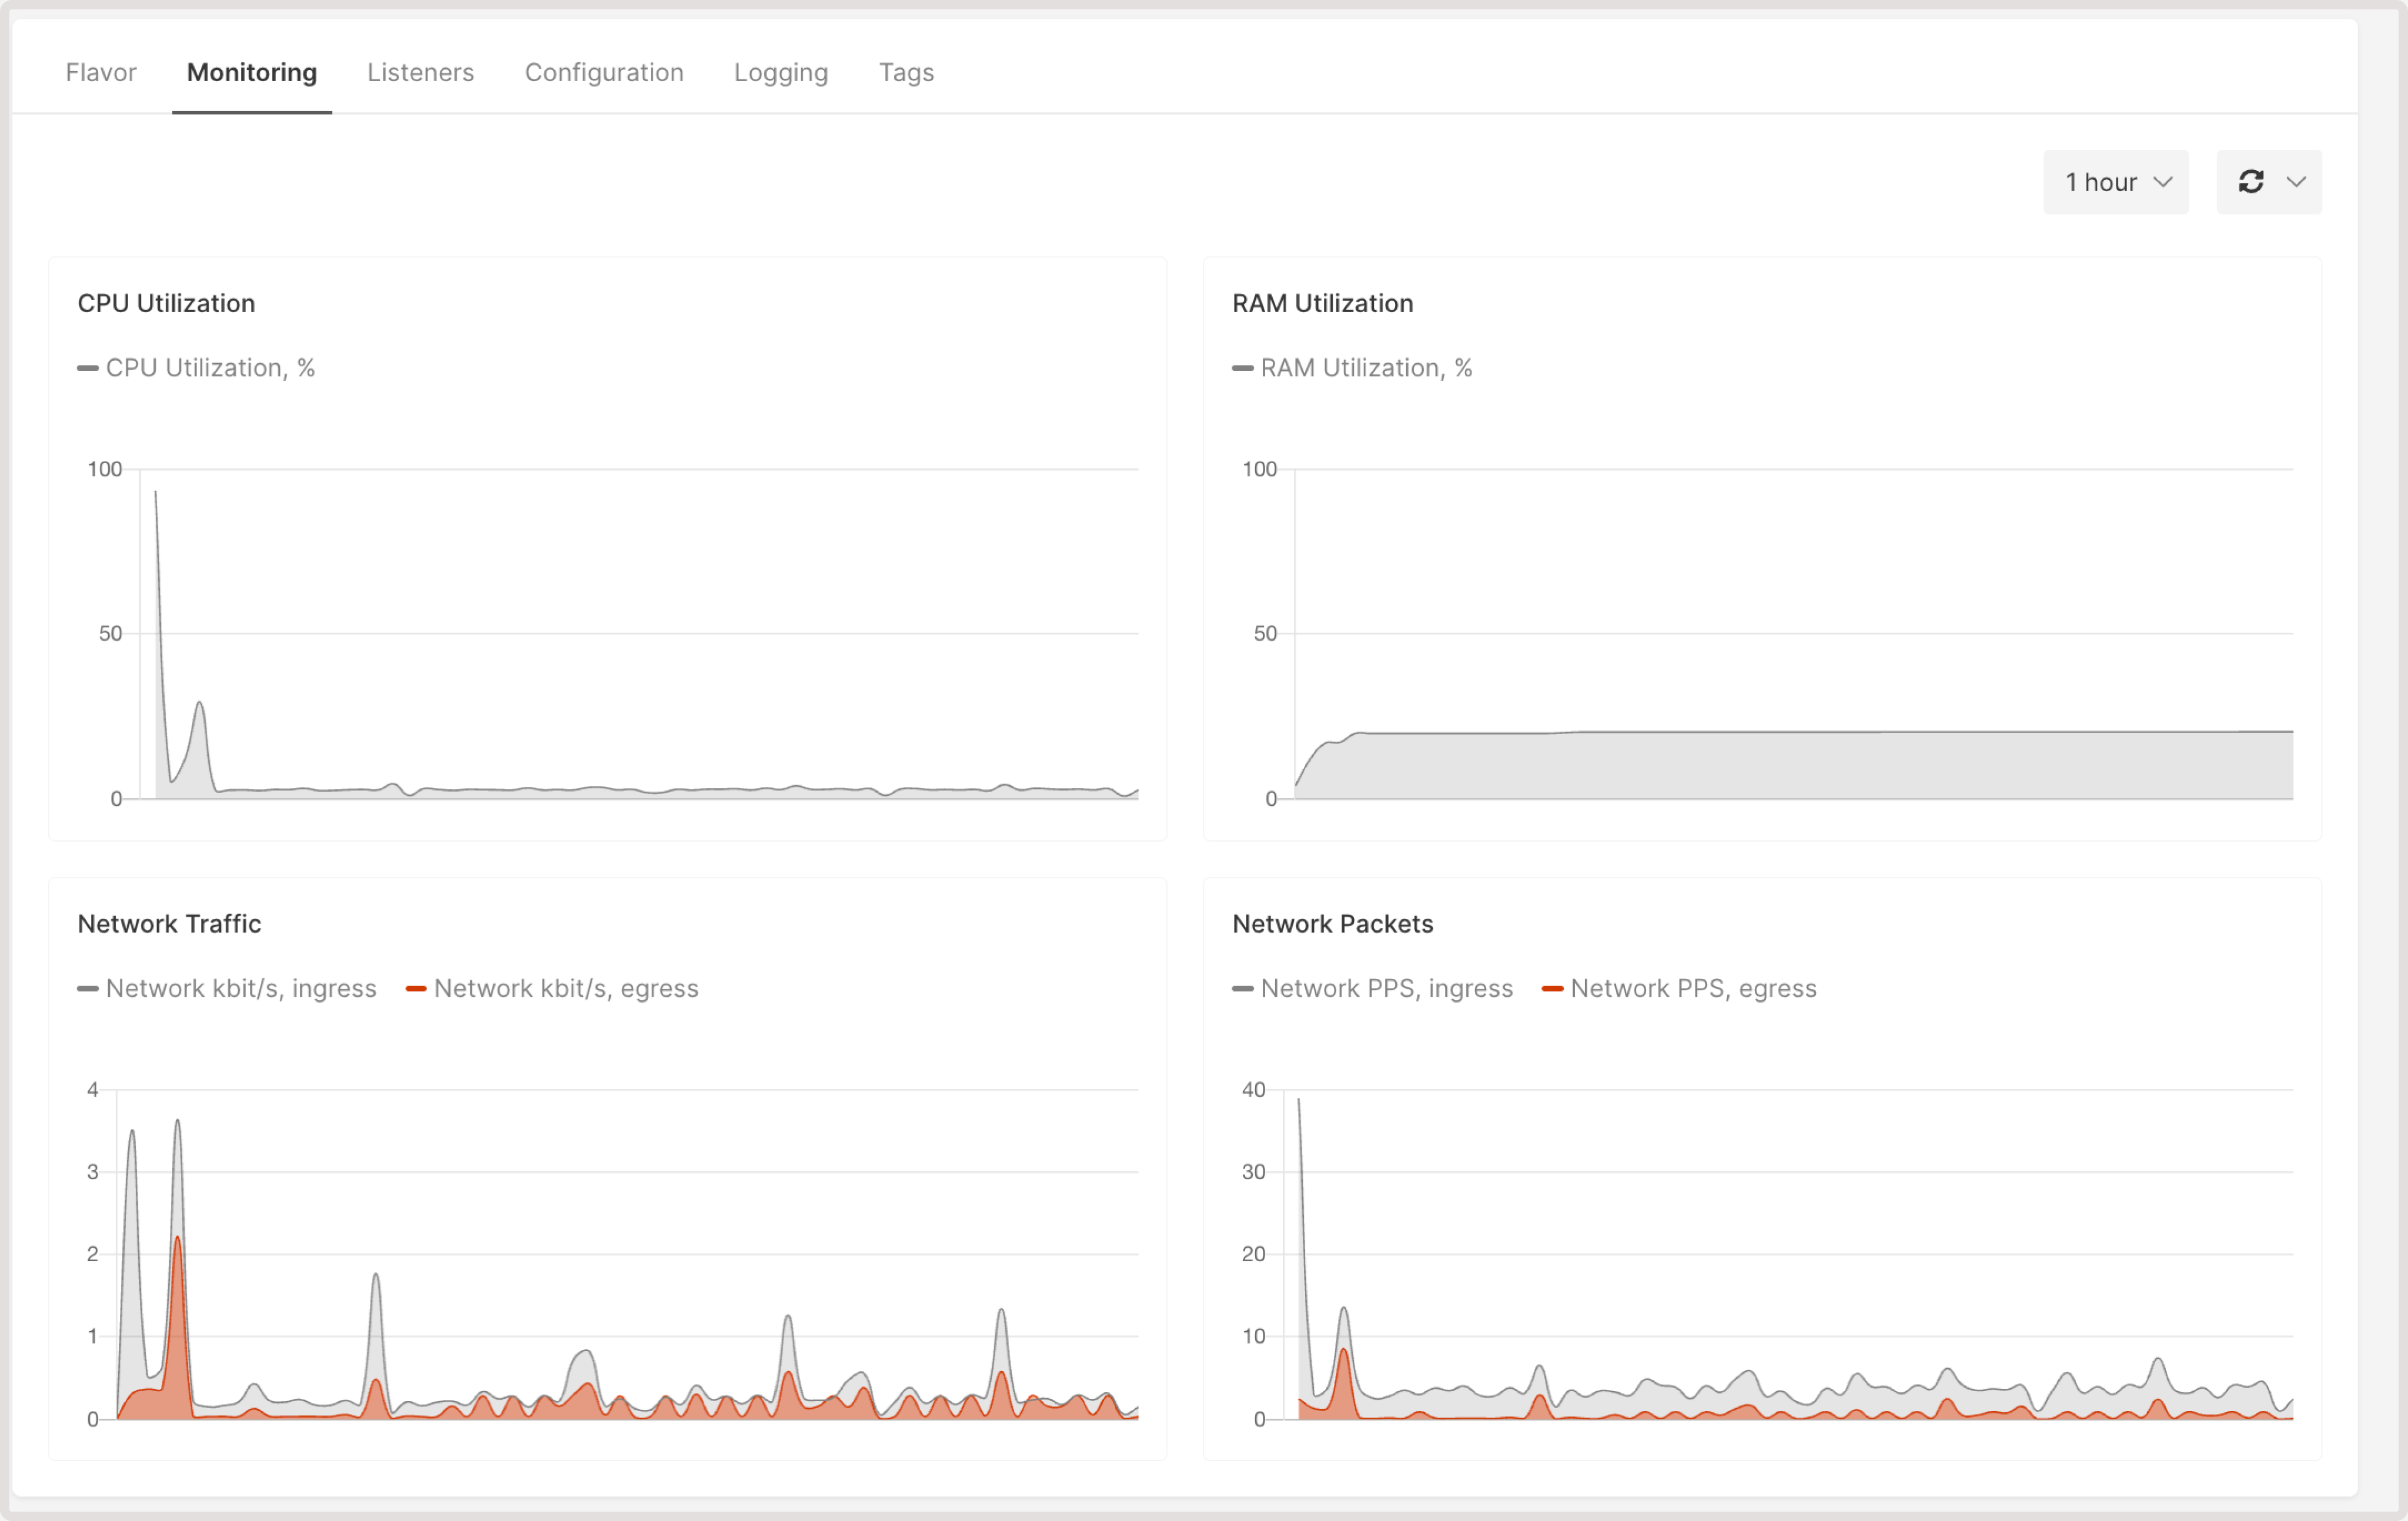
- CPU Utilization, %: The percentage of currently used Load Balancer’s CPU. It’s a key performance indicator that can help you understand if the Load Balancer is nearing its capacity limits. High CPU usage is typically observed with a large number of connections or high volumes of traffic.
- RAM Utilization, %: The percentage of total available memory currently used by the Load Balancer. High RAM utilization indicates that the Load Balancer is handling a large number of connections or running memory-intensive processes, which is common with terminated HTTPS traffic. Other types of traffic generally consume less RAM.
- Network traffic : The rate of incoming (ingress) and outgoing (egress) network traffic measured in kilobits per second (kbit/s). The metrics can help you understand the network load on the Load Balancer.
- Network packets : Network packets per second (PPS) measure the rate of network packets being received (ingress) and sent out (egress) by the balancer.
Listeners
Listener is a process that checks for connection requests using the configured protocol and port. A listener contains a pool—a list of virtual machines or Bare Metal servers that will receive traffic from the listener. Listener configuration:- Name : Name of the listener.
- Protocol : The network protocol that defines what type of traffic will be handled by the listener.
- Port : The network port that the listener monitors for incoming connections.
- Pools : The number of backend server pools (often called members or backends) that handle the traffic received by the listener.
Operating status : The current operational state of the listener. “Online” means it is functioning and can receive traffic. - Provisioning status : The status of the configuration process for the listener. “Active” suggests that it has been fully configured and is operational.

InfoYou can’t add multiple listeners with the same L4 type and port number. For example, you can create a listener with TCP 80 and UDP 80 but not a listener with TCP 80 and TCP 80.It’s also not possible to use both TCP 80 and HTTP 80. The reason is that HTTP is an L7 protocol based on L4 TCP, so in this case, it’s perceived as TCP 80 + TCP 80.
Pool settings
A pool is the list of VMs or Bare Metal to which the listener will redirect incoming traffic. Each pool in the listener has the following configuration:- Name : The name of the pool.
- Algorithm : The load-balancing method used to distribute traffic among instances in the pool. Check available algorithms in pool settings.
- Instance count : The number of Virtual Machines whose traffic is managed by a Load Balancer.
- Health Check : The method used to determine the health of the instances in the pool.
- Operating status : The current operational state of the pool. “Online” indicates that the pool can handle traffic.
- Provisioning status : The status of the configuration process for the pool. “Active” means the pool is fully set up and ready for use.
- Protocol : The network protocol that the pool uses to communicate with instances and members.
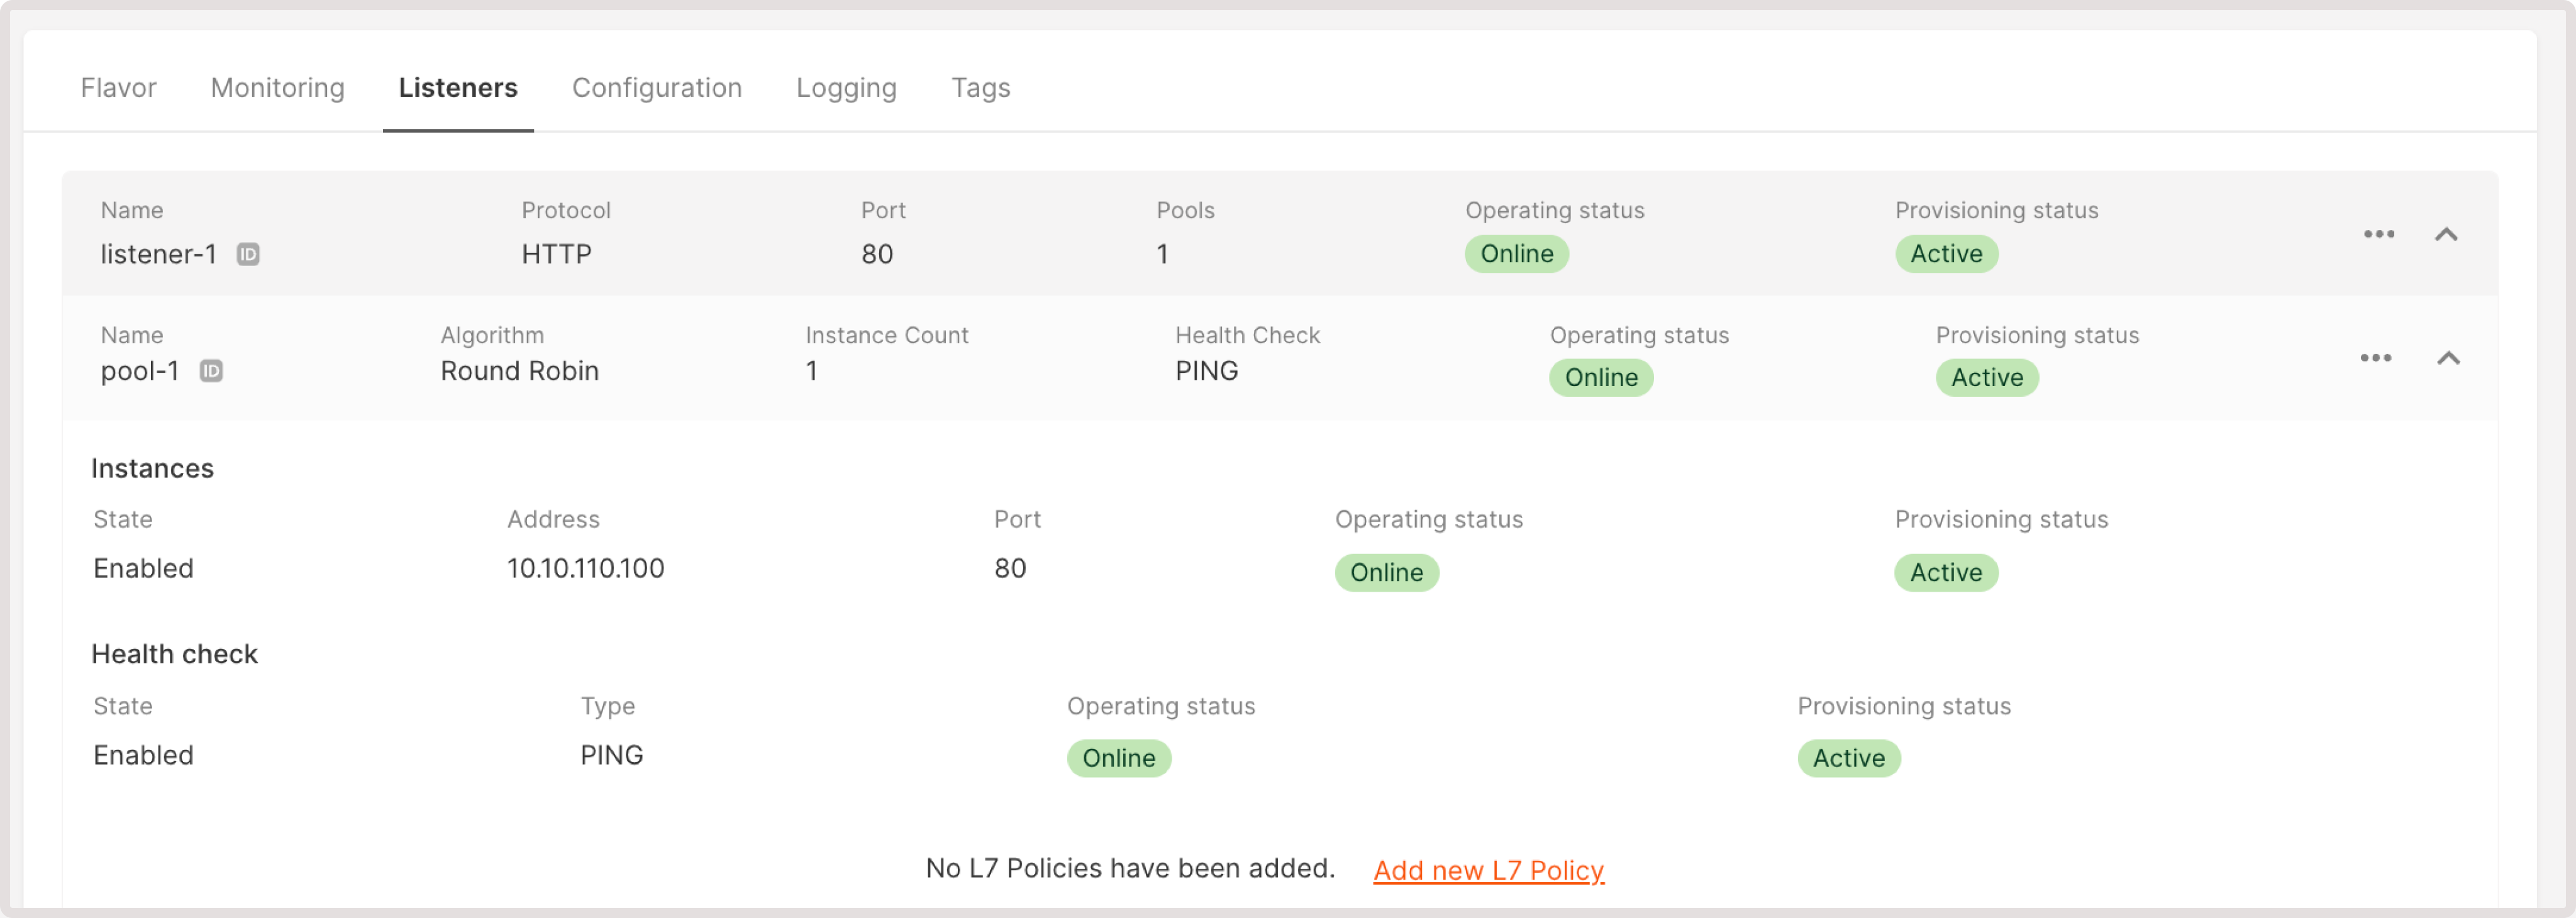
- State : Whether the instance is enabled or disabled within the pool. “Enabled” means that the instance is active and can receive traffic from the Load Balancer.
- Type : The category of the instance. It can be an instance (Virtual Machine), Bare Metal, or any custom IP.
- Instance : Unique identifier of the instance.
- Address : IP address of the instance that’s used by the Load Balancer to forward traffic to this instance.
- Port : The network port on which the instance listens.
- Weight : Distribution of traffic among Virtual Machines or Bare Metal servers in the pool. A weight can be assigned to each VM or Bare Metal to influence how much traffic it should handle compared to other instances. A higher weight means that more traffic will be directed to that particular resource.

- Protocol : The method used by a Load Balancer to check the health of the pool members.
- Check interval : The frequency of performing health checks. Typically, the optimal time is less than 10 seconds.
- Response time : The maximum time a Load Balancer will wait for a response to a health check. A response time of “5 sec” means that if a server doesn’t respond to a ping within 5 seconds, it is considered unresponsive for this health check instance.
- Unhealthy thresholds : This is the number of consecutive failed health checks required before a server is considered unhealthy and removed from the pool for traffic distribution.
- Healthy thresholds : The number of consecutive successful health checks required for a server to be considered healthy and added back to the pool.

- Client Data (timeout client) : The maximum amount of time a Load Balancer will wait for a client to send data. After that, the connection will be closed.
- Member Connect (timeout connect) : The maximum amount of time a Load Balancer will wait to establish a connection with a pool member. If the connection is not established within that timeframe, it’s considered a failed attempt.
- Member Data (timeout server) : The maximum amount of time a Load Balancer will wait for a pool member to send data once a connection has been established. If no data is sent within this timeframe, the connection times out.

L7 policies
L7 policy specifies how to manage and route incoming traffic at the application layer (Layer 7 of the OSI model).Listener statistics
- Name : Name of each listener.
- Active connections : Number of ongoing connections to each listener.
- Bytes in : Total amount of data received by the listener.
- Bytes out : Total amount of data sent from the listener.
- Request errors : Total number of request errors encountered by the listener.
- Total connections : The cumulative number of connections handled by the listener since it was started.

Configuration
This tab allows you to change the flavor of your Load Balancer based on the requirements of your workload, expected traffic, the computing resources needed, and others.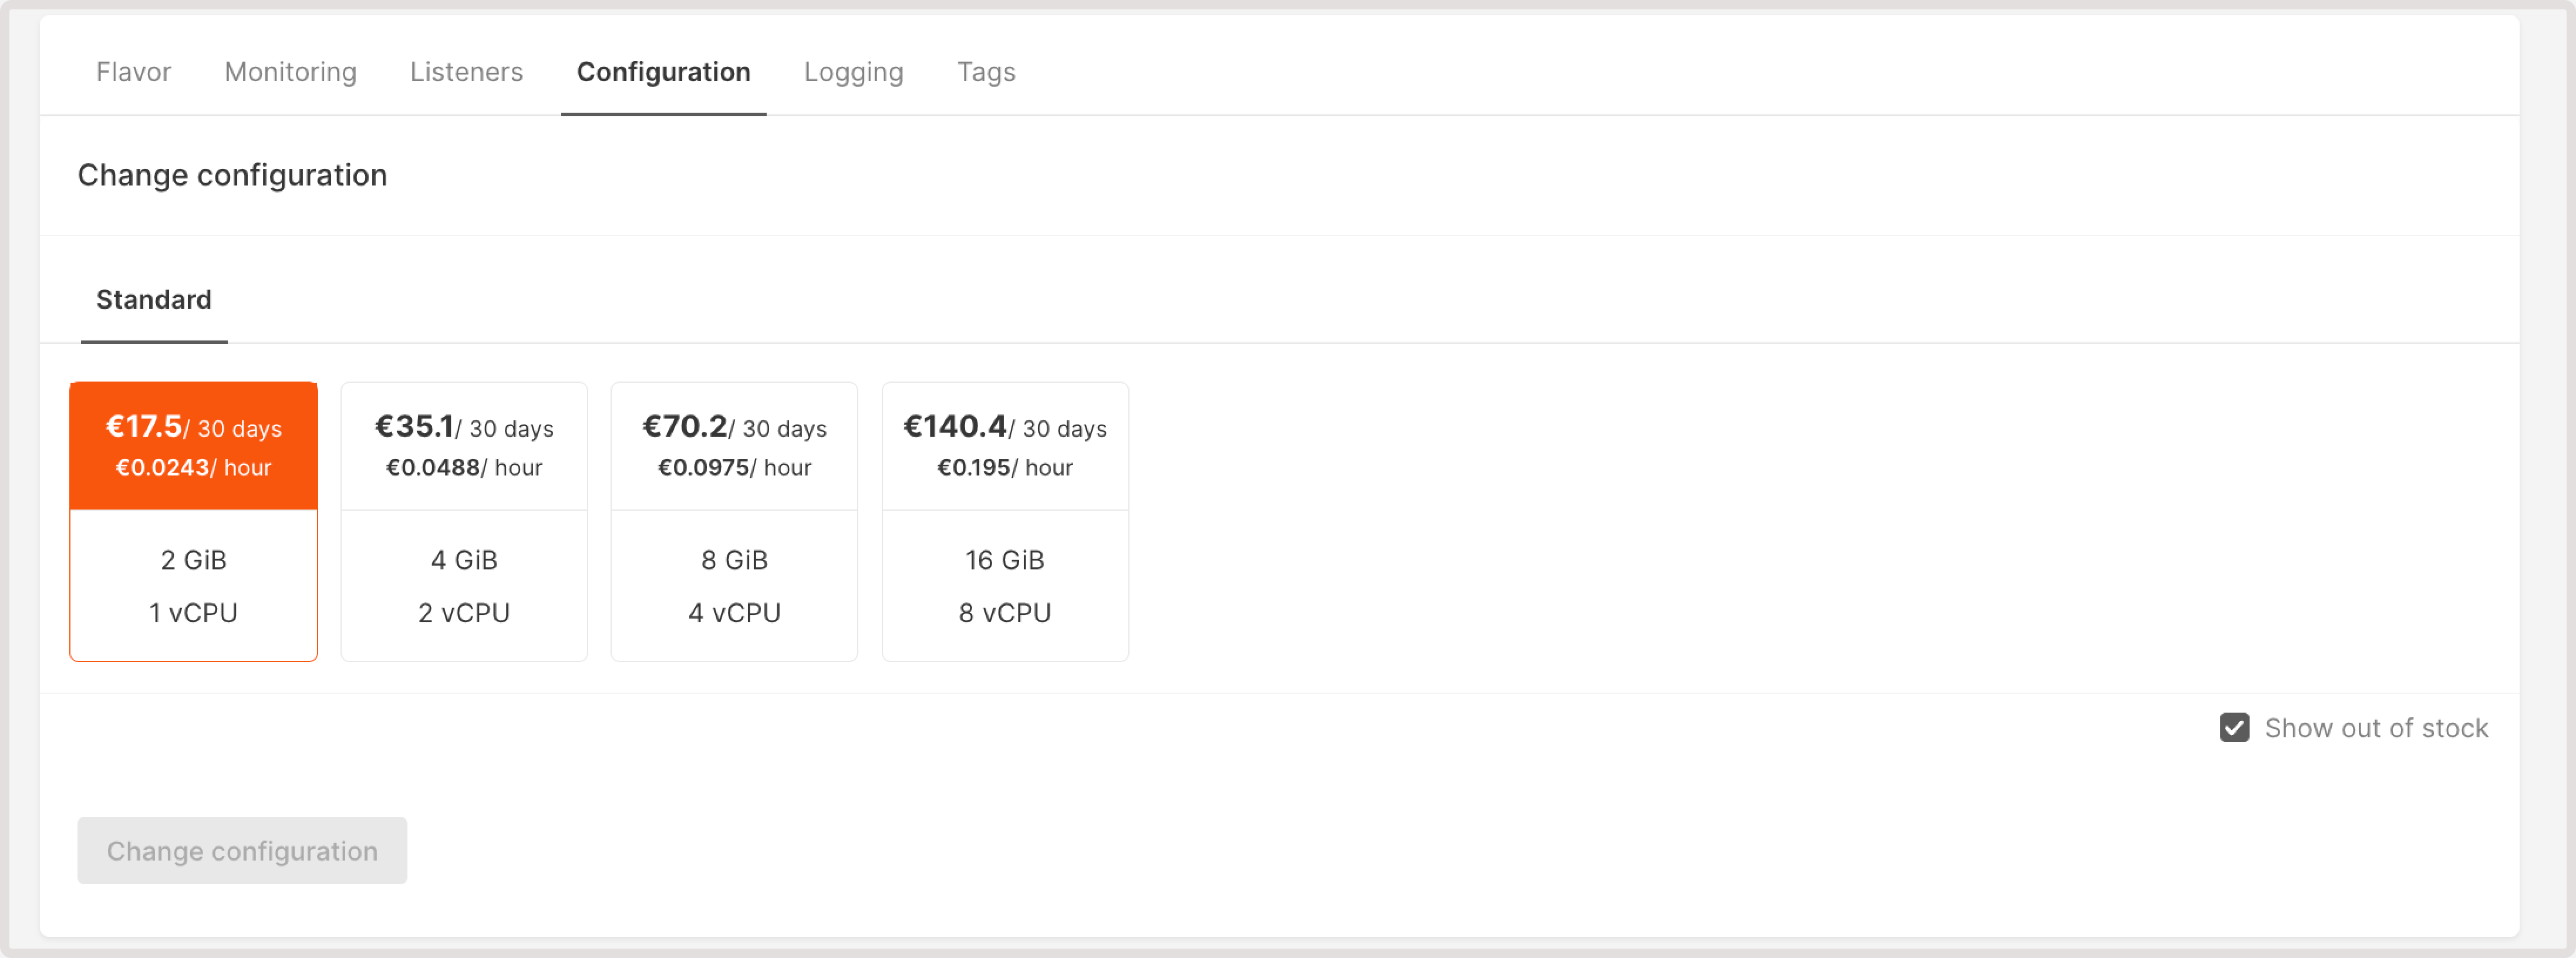
Logging
Record detailed information about the traffic processed by a Load Balancer. This data is useful for debugging, monitoring, and analyzing the behavior of your applications. Our Logging for Load Balancers guide covers all available settings and configuration steps.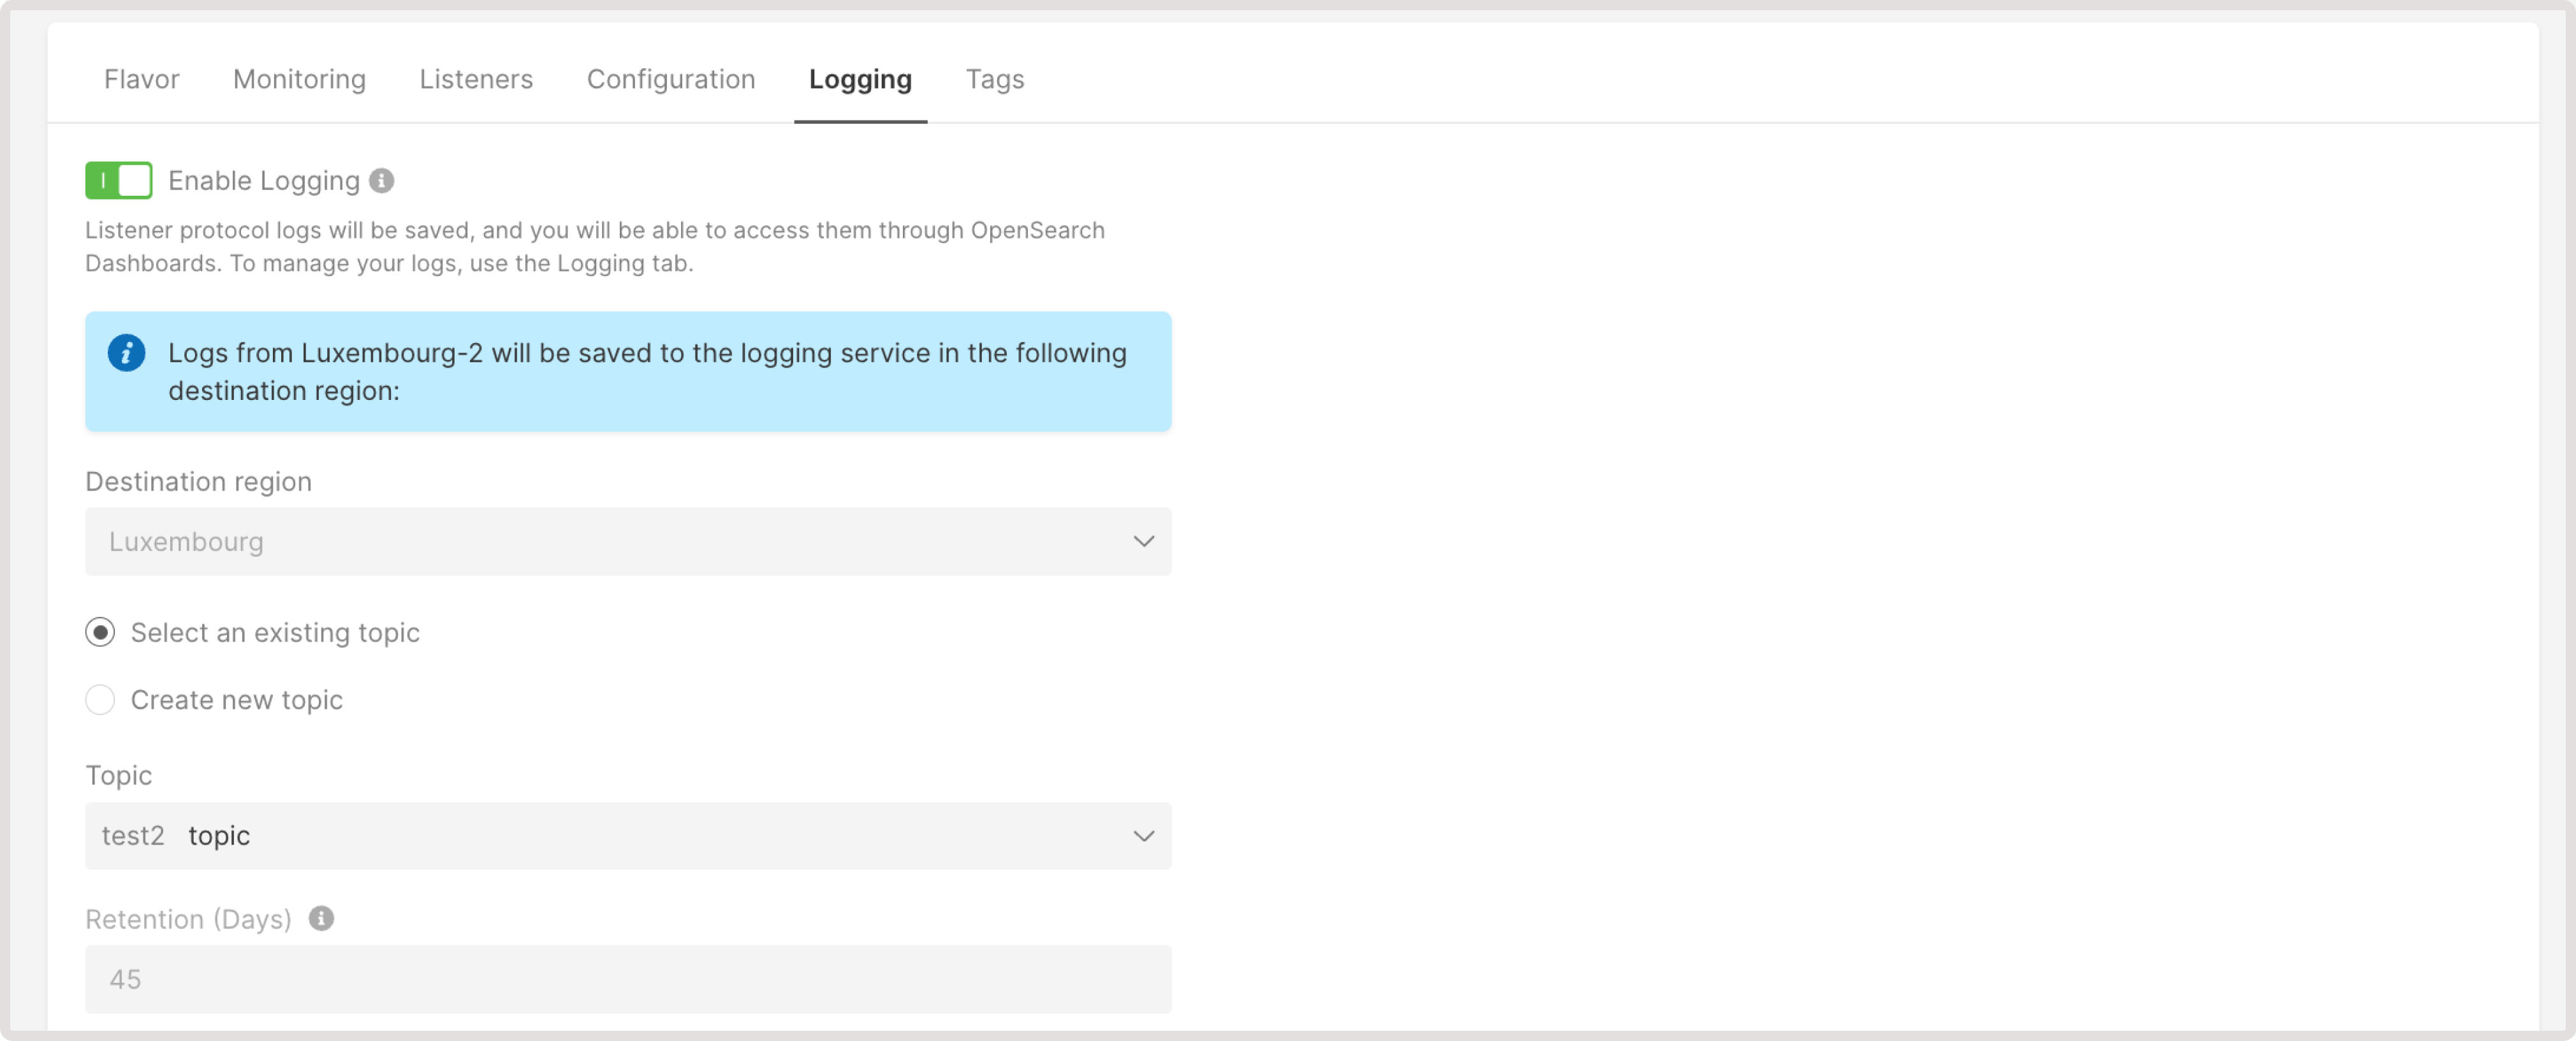
Custom tags
On this tab, you can review and assign metadata to a Load Balancer. You can use tags to group multiple resources that belong to the same functionality. For instance, if you have a single project with different services—such as an authentication service, a shop service, and a cart service—each service can have its own Load Balancer. By applying tags, you can easily organize and manage these resources as a group.
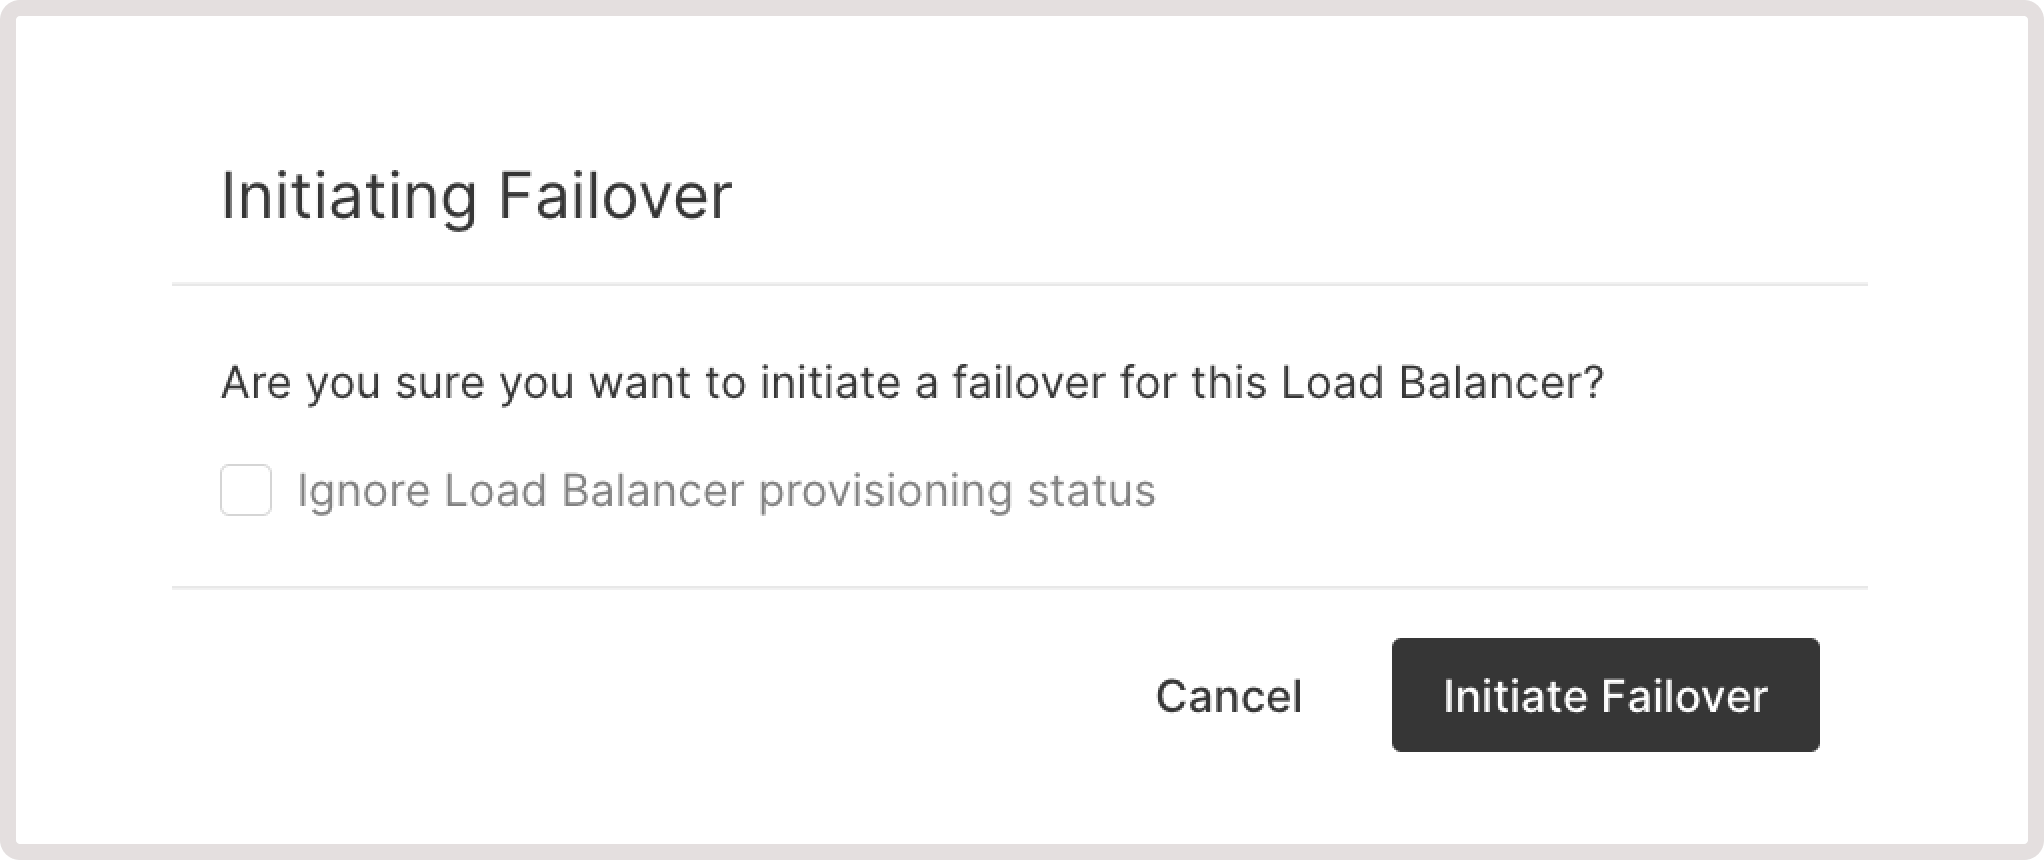
Initiate a failover
The failover mechanism automatically detects Load Balancers that have failed or demonstrate degraded performance. When you initiate a failover, the traffic is redirected to an alternate Load Balancer within your network infrastructure. The second balancer immediately takes over the duties of the failed one without interrupting the availability of your application. To initiate a failover: 1. Navigate to Cloud > Networking. 2. Open the Load Balancers page.

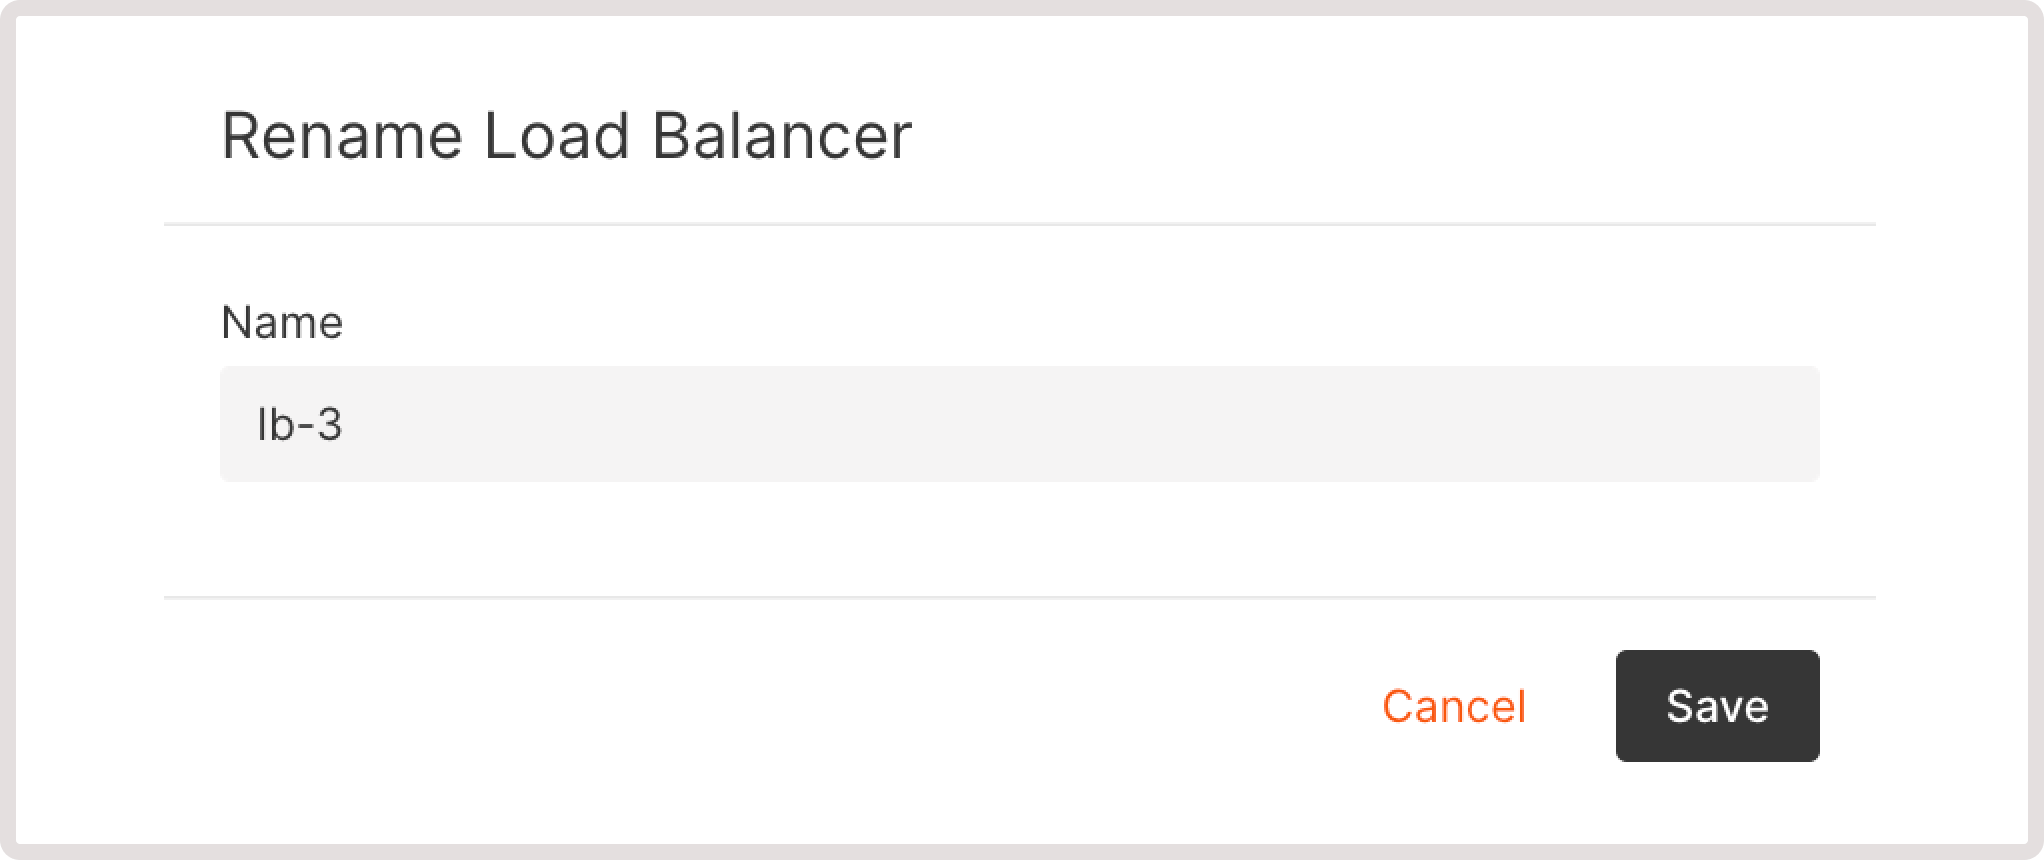
Rename a load balancer
1. Navigate to Cloud > Networking. 2. Open the Load Balancers page.

Edit tags
To update metadata assigned to a Load Balancer: 1. Navigate to Cloud > Networking. 2. Open the Load Balancers page.

Delete a load balancer
1. Navigate to Cloud > Networking. 2. Open the Load Balancers page.