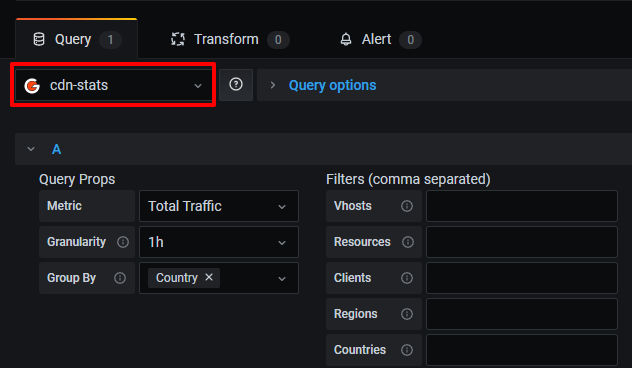
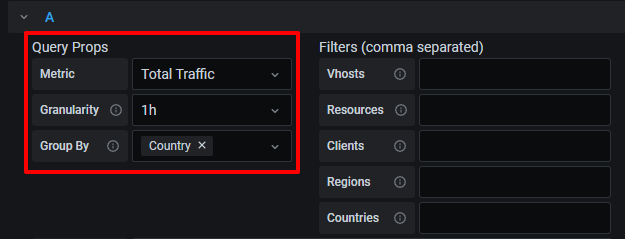
- Total Traffic, which is total traffic volume, consisting of traffic from origin to CDN or Shielding + from Shielding to CDN + from CDN to users;
- Byte cache Hit Ratio, which is the share of cached traffic, calculated using the formula: 1-(traffic from the origin to the CDN or Shielding/traffic from the CDN to users);
- Edges Traffic, which is traffic from CDN, consisting of traffic from Shielding to CDN + from CDN to users;
- Shield Traffic, which is traffic from Shielding to CDN;
- Origin Traffic, which is traffic from the origin, consisting of traffic from the origin to the CDN or from the origin to the Shielding;
- Total Requests, which is the number of requests to the CDN;
- 2xx, 3xx, 4xx, 5xx Responses, which is the number of 2xx, 3xx, 4xx, and 5xx responses;
- Bandwidth, which is bandwidth, calculated based on traffic from the origin to the CDN or Shielding + from Shielding to CDN + from CDN to users;
- Cache Hit Ratio, which is the share of sending cached content, consisting of responses with cached content / requests to CDN;
- Shield traffic ratio is the efficiency of the Shielding: how much more traffic is sent from the Shielding than from the origin, calculated using the formula: (traffic from the Shielding to the CDN - traffic from the origin to the Shielding) / traffic from the Shielding to the CDN;
- Clients is for clients;
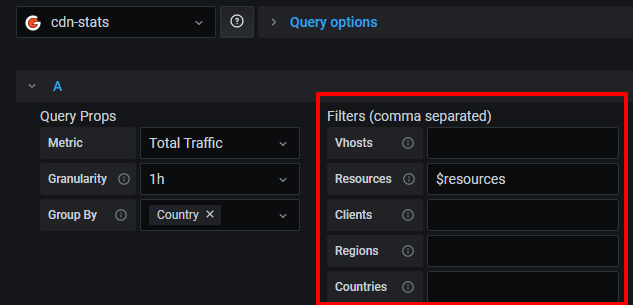
- Resource is for CDN resources;
- Region is for regions;
- Country is for countries;
- Data is for data centers;
- Vhost is for a personal domain.
- Use Grafana version 7.0 and higher.
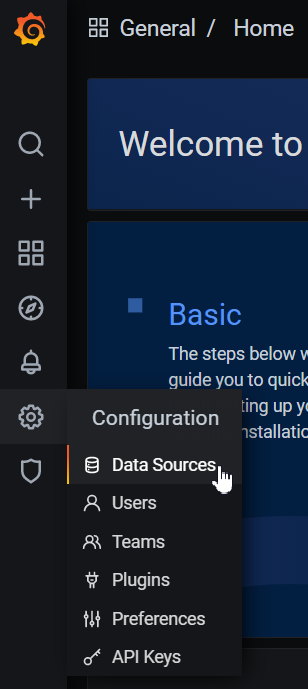
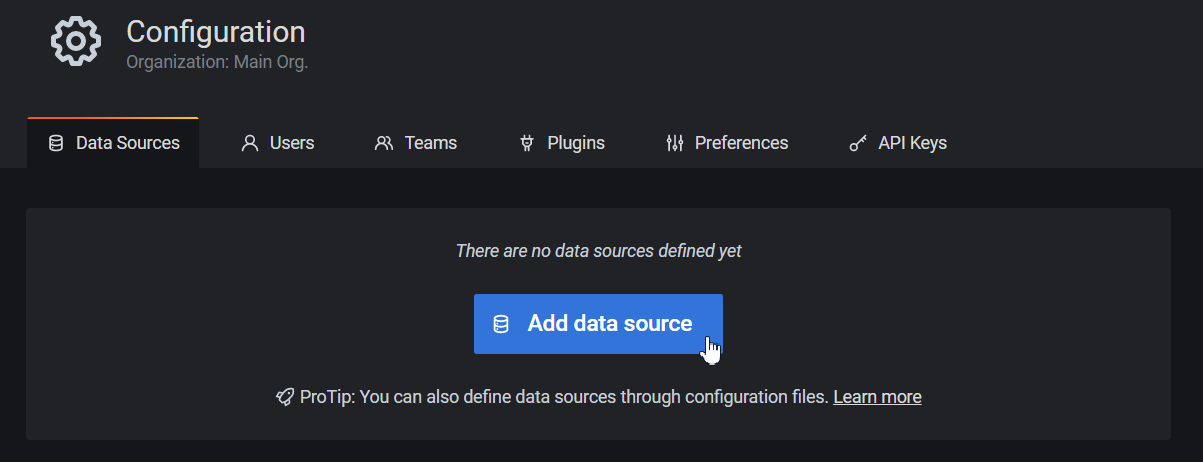
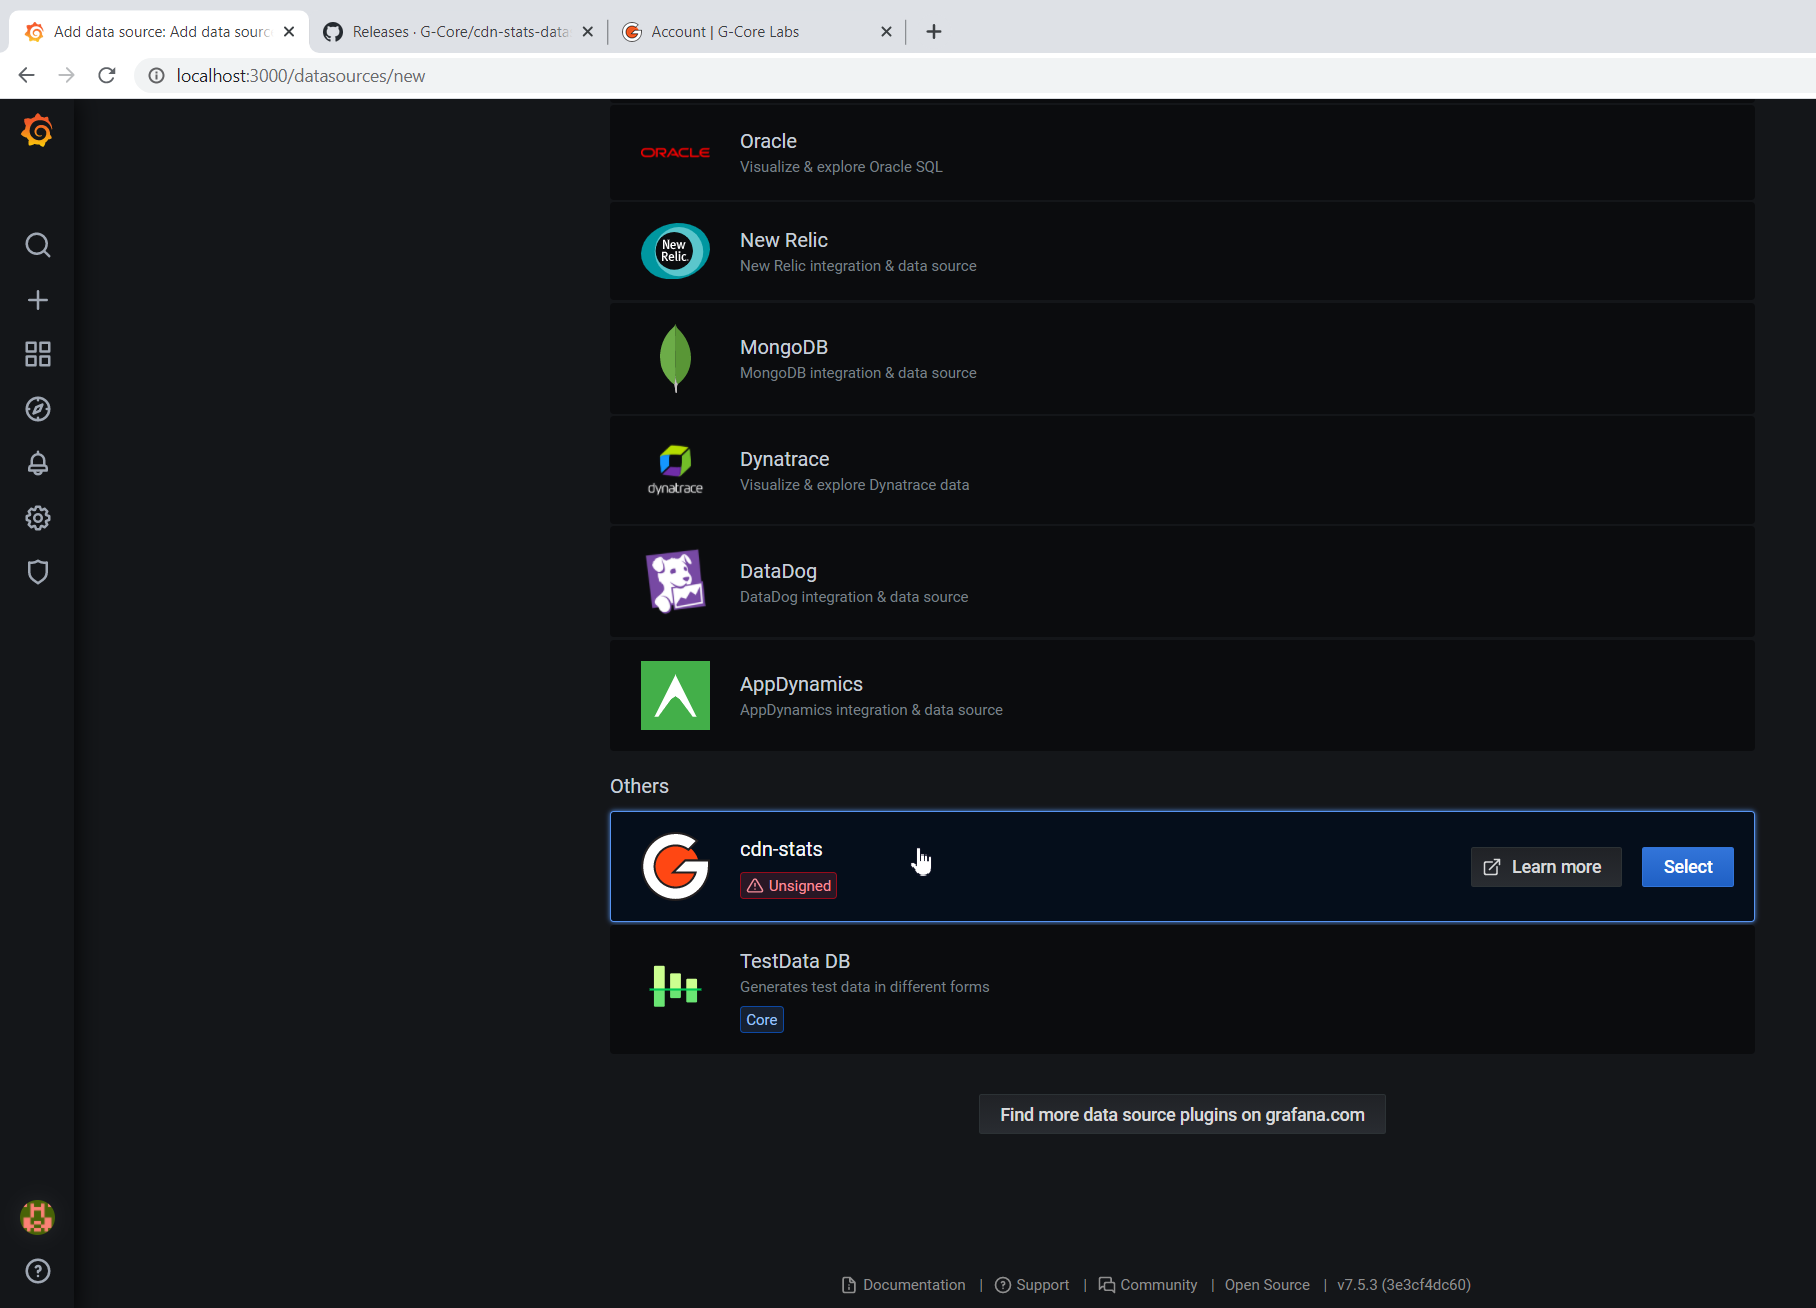
Download and install the plugin
Download the gcore-cdn-stats-datasource-1.0.8.zip file with the latest version of the plugin in GitHub. Note : The numbers (1.0.8) in the file name indicate the plugin version and may differ depending on updates.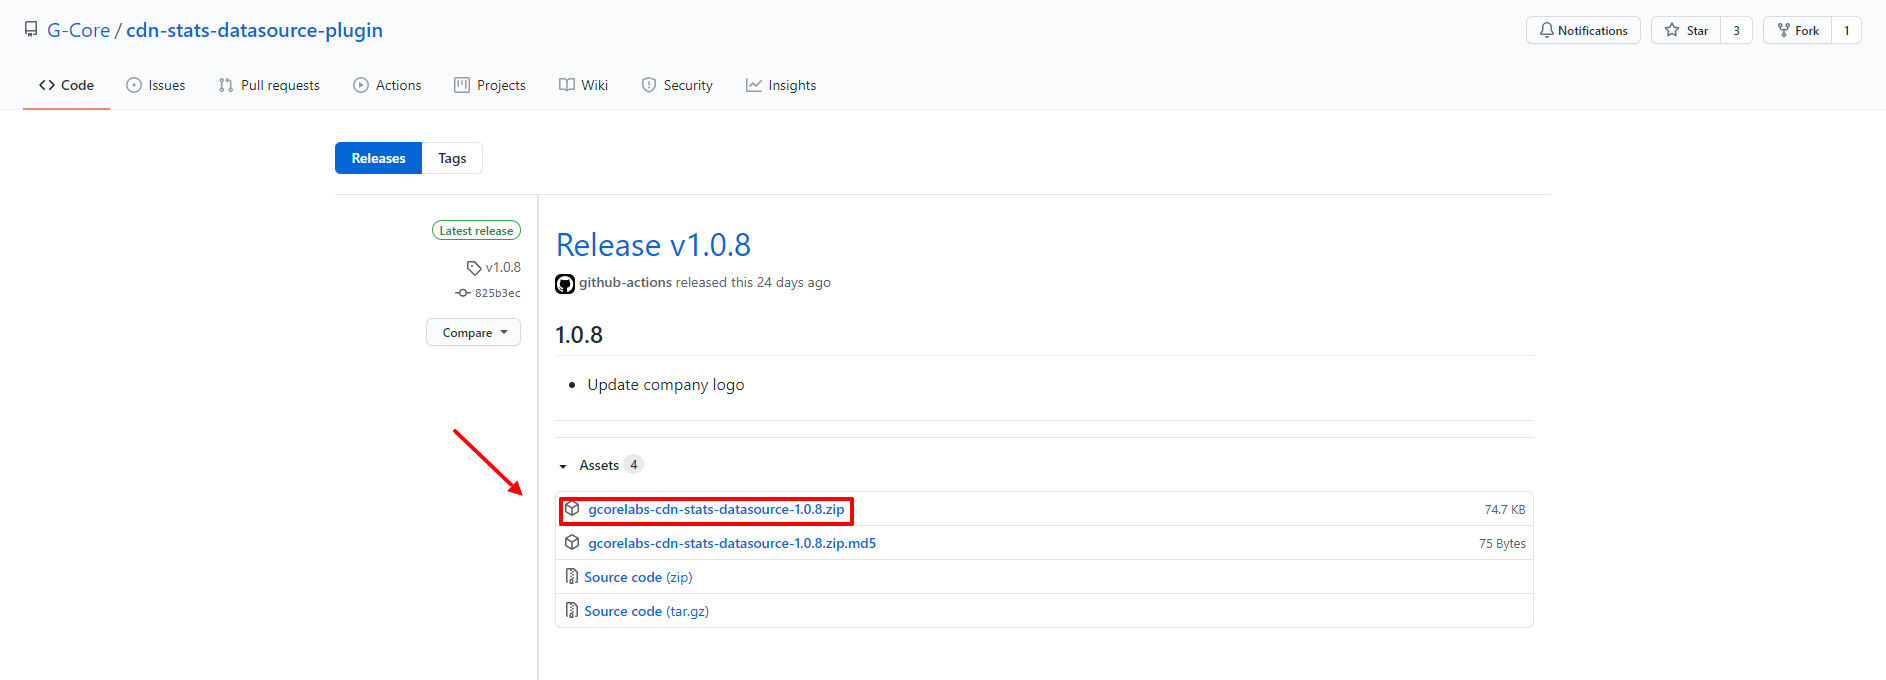
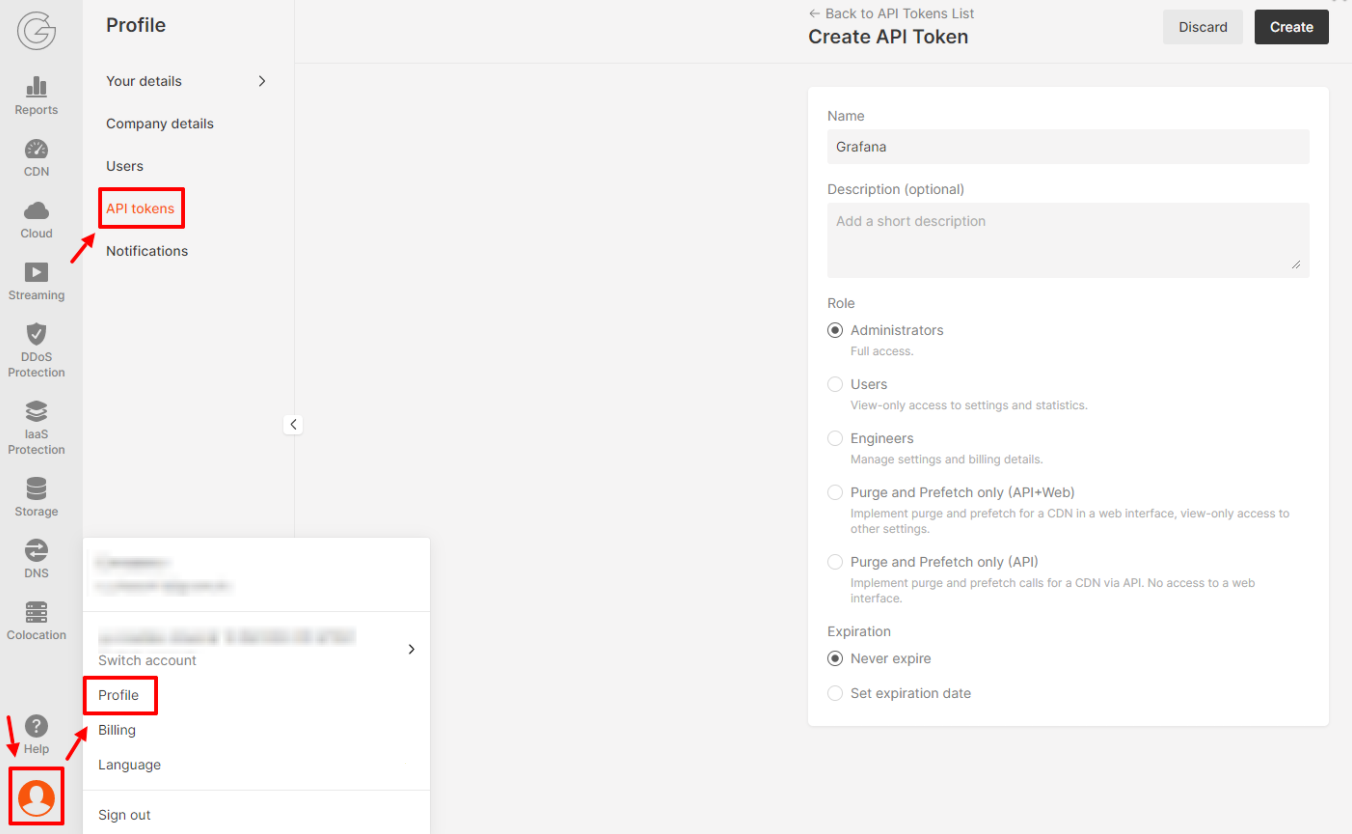
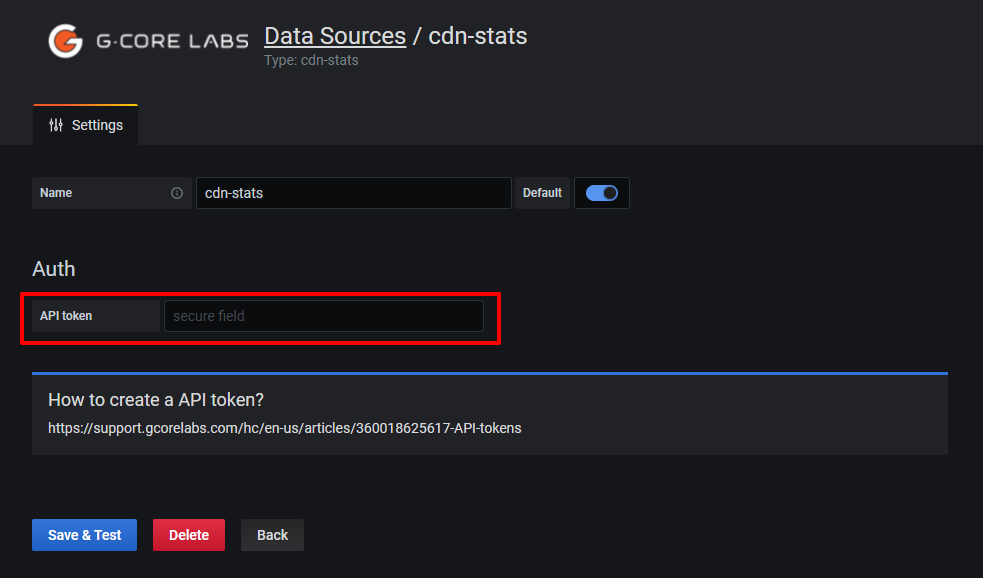
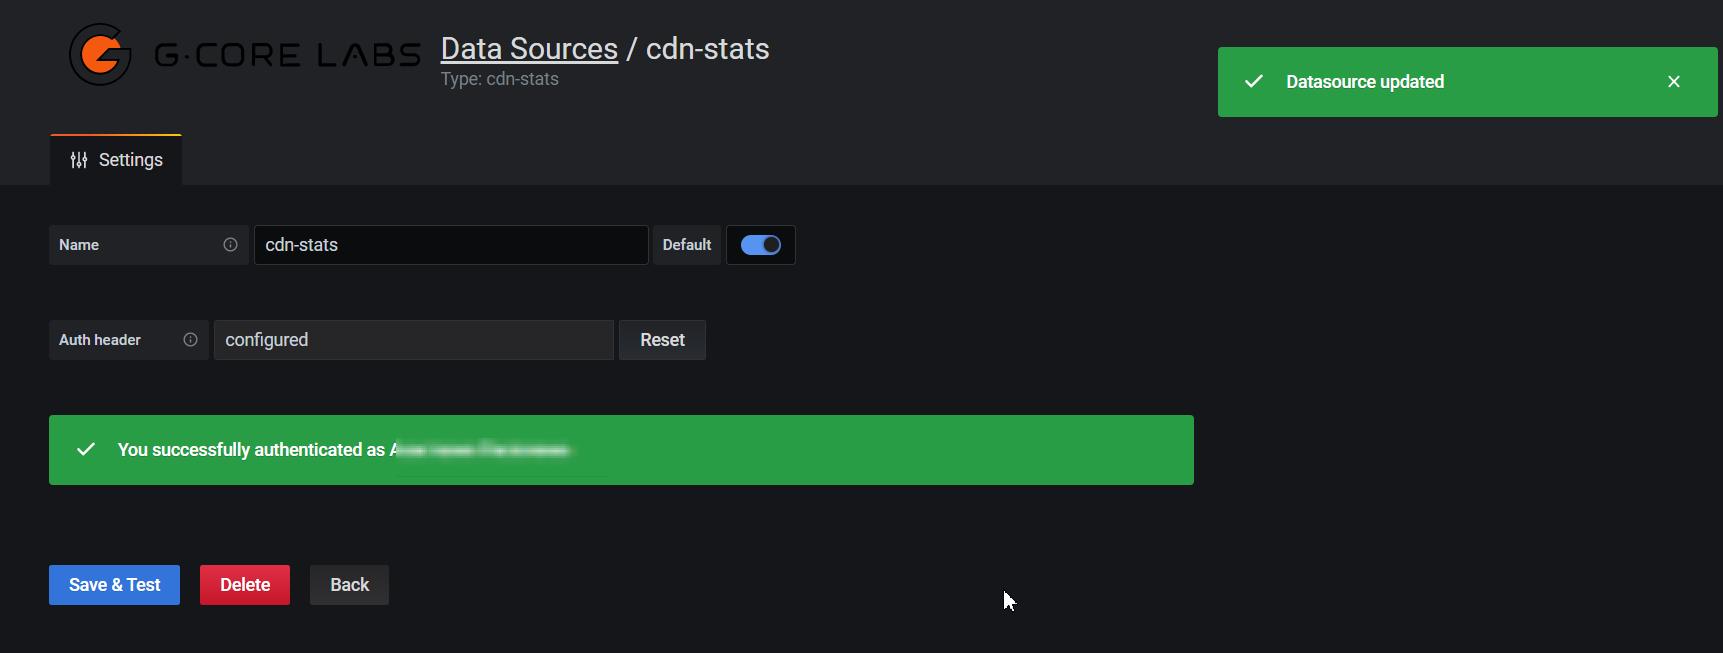
{the received API token}.
For example: APIKey 7711$eyJ0eXAiOiJKV
The Download and install the plugin step video instructions
Configure the dashboard
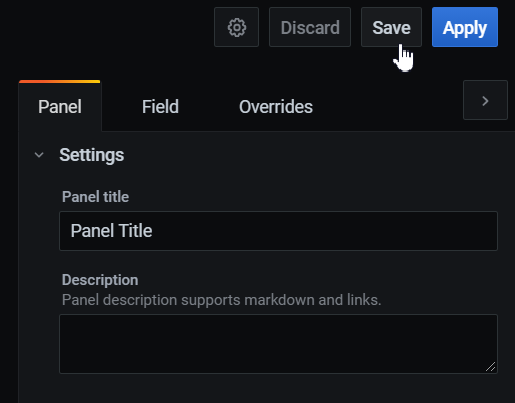
Click on the + in the menu to open the “Create” section, select “Dashboard” to add a new dashboard.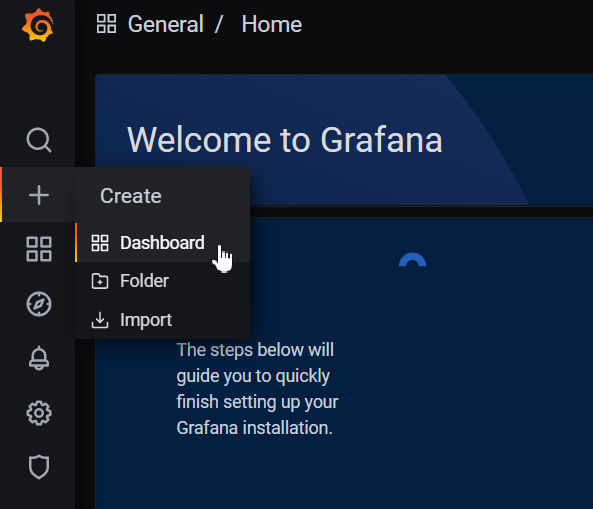
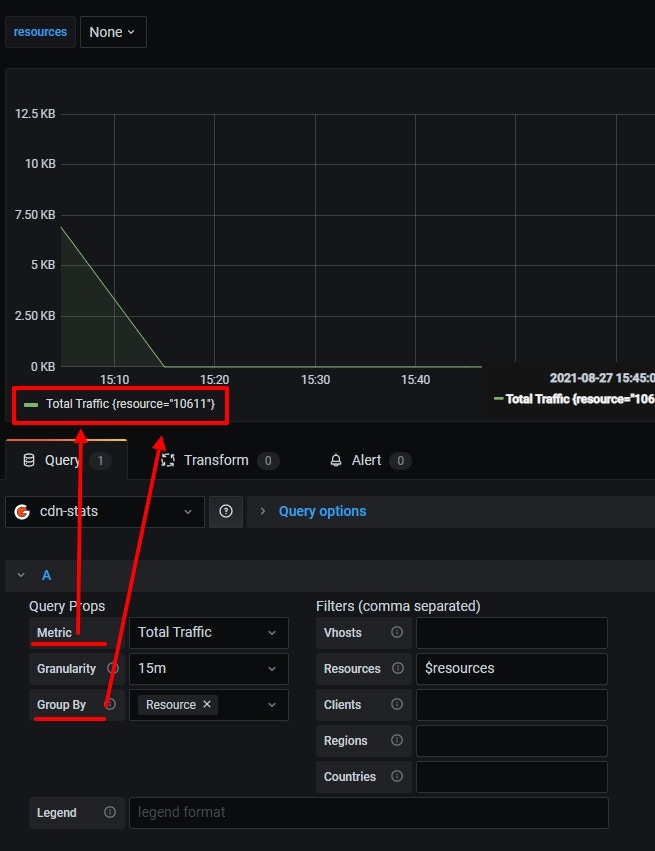
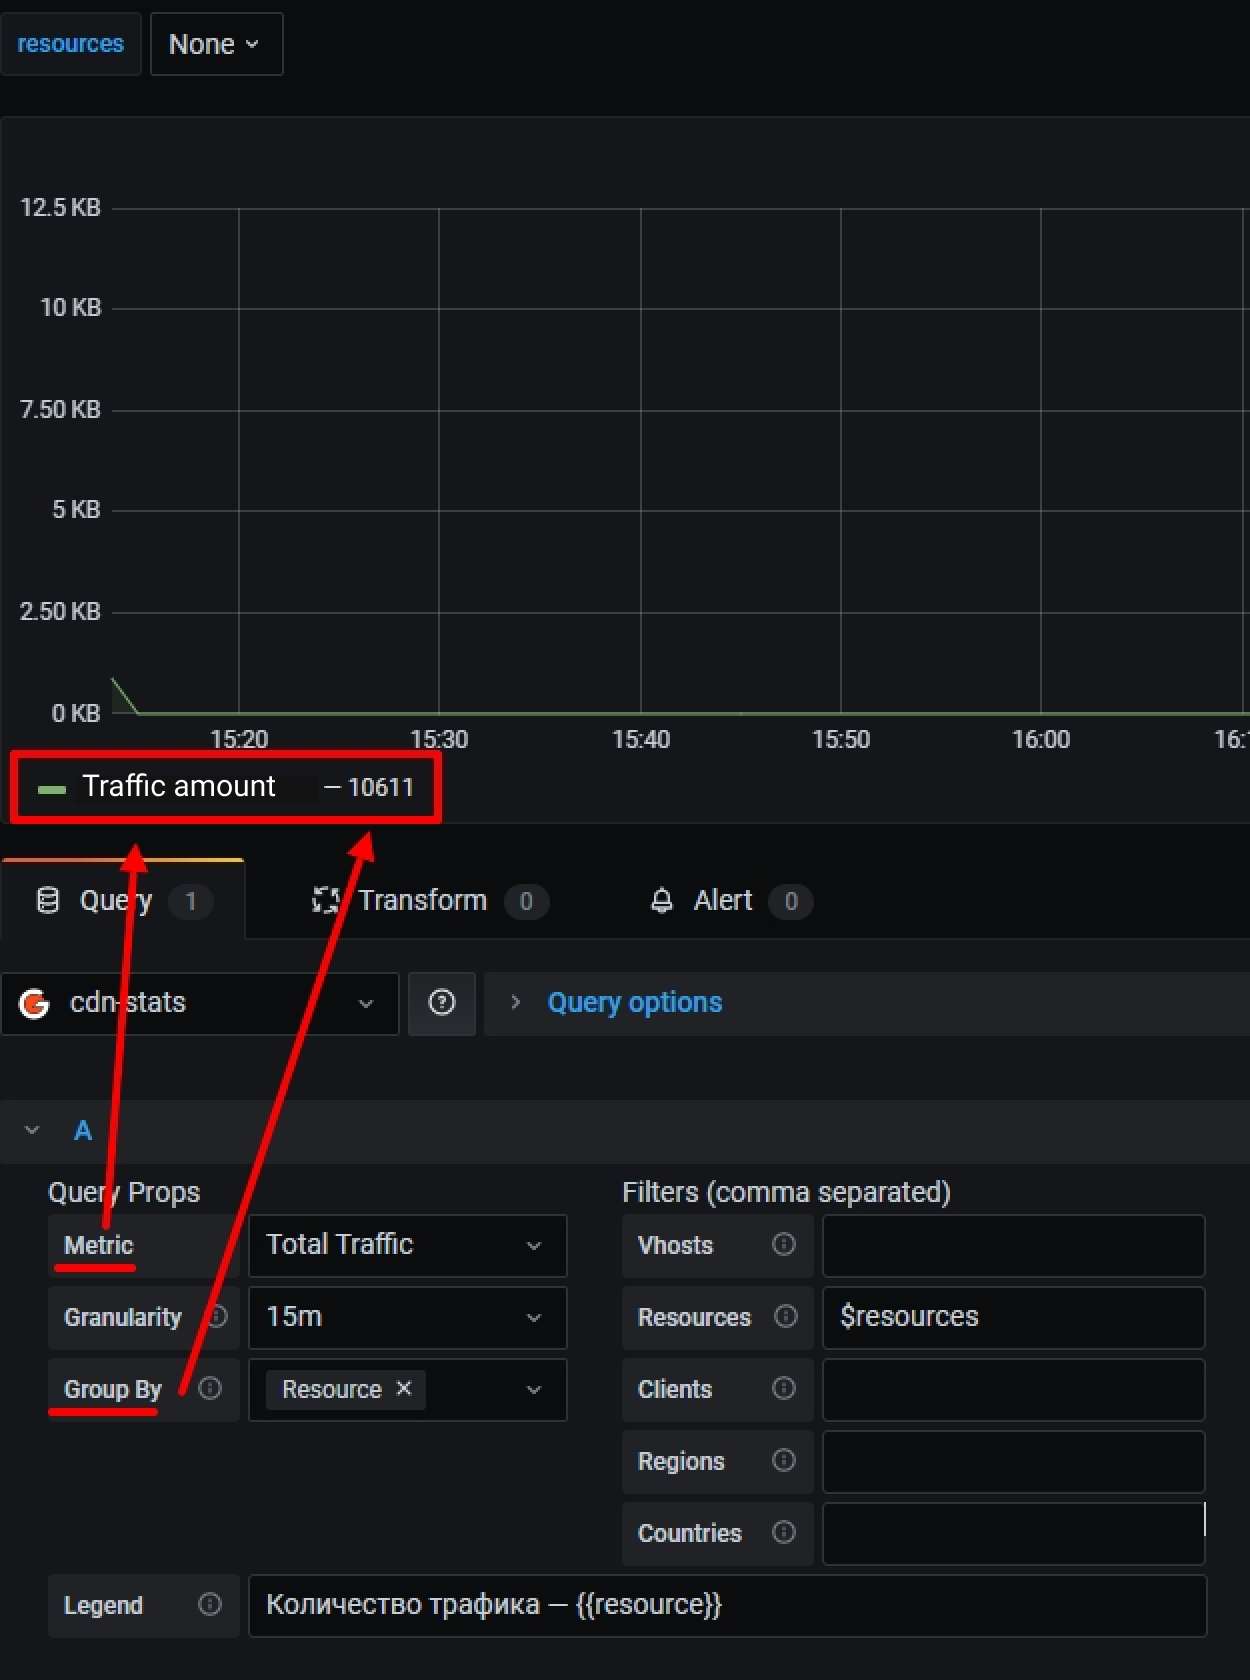
{{}} set the parameters specified in the Group by field.
For example, for the settings above, you can set the following format: Traffic quantity — {{resource}}.
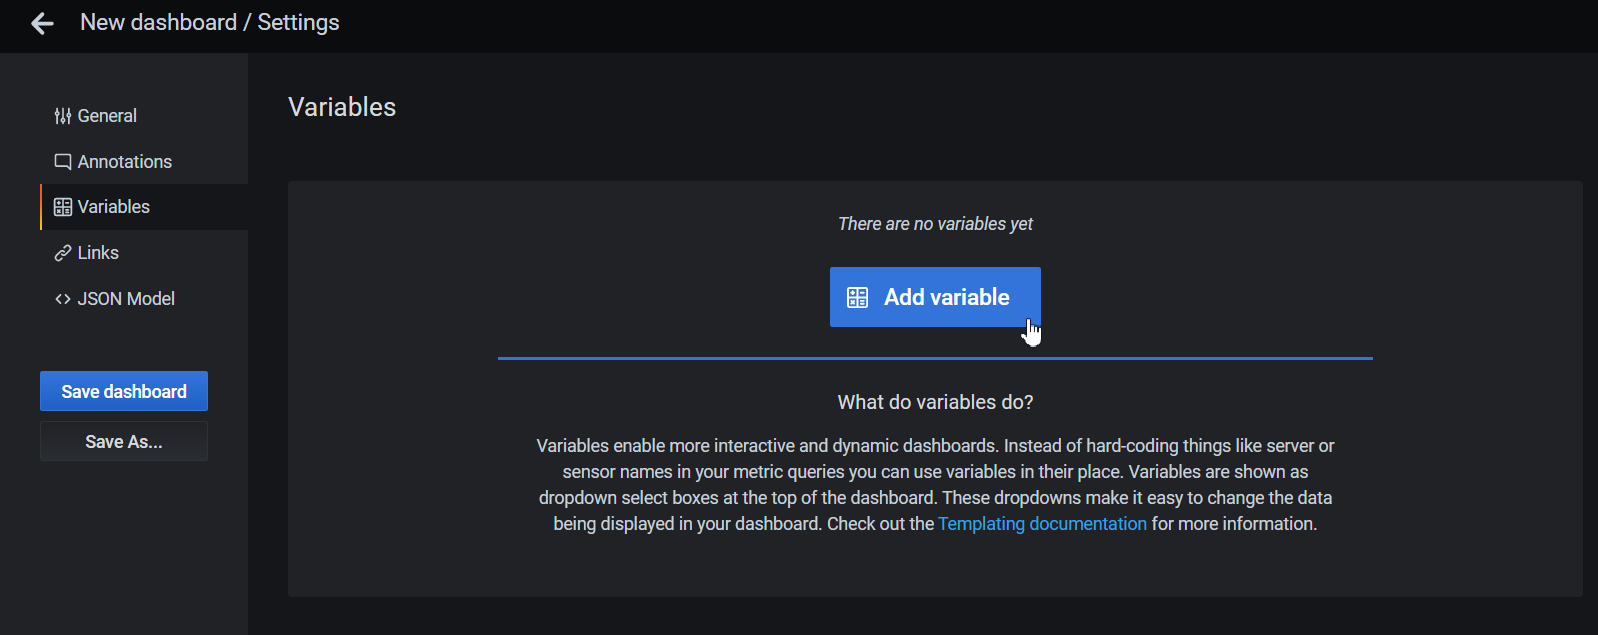
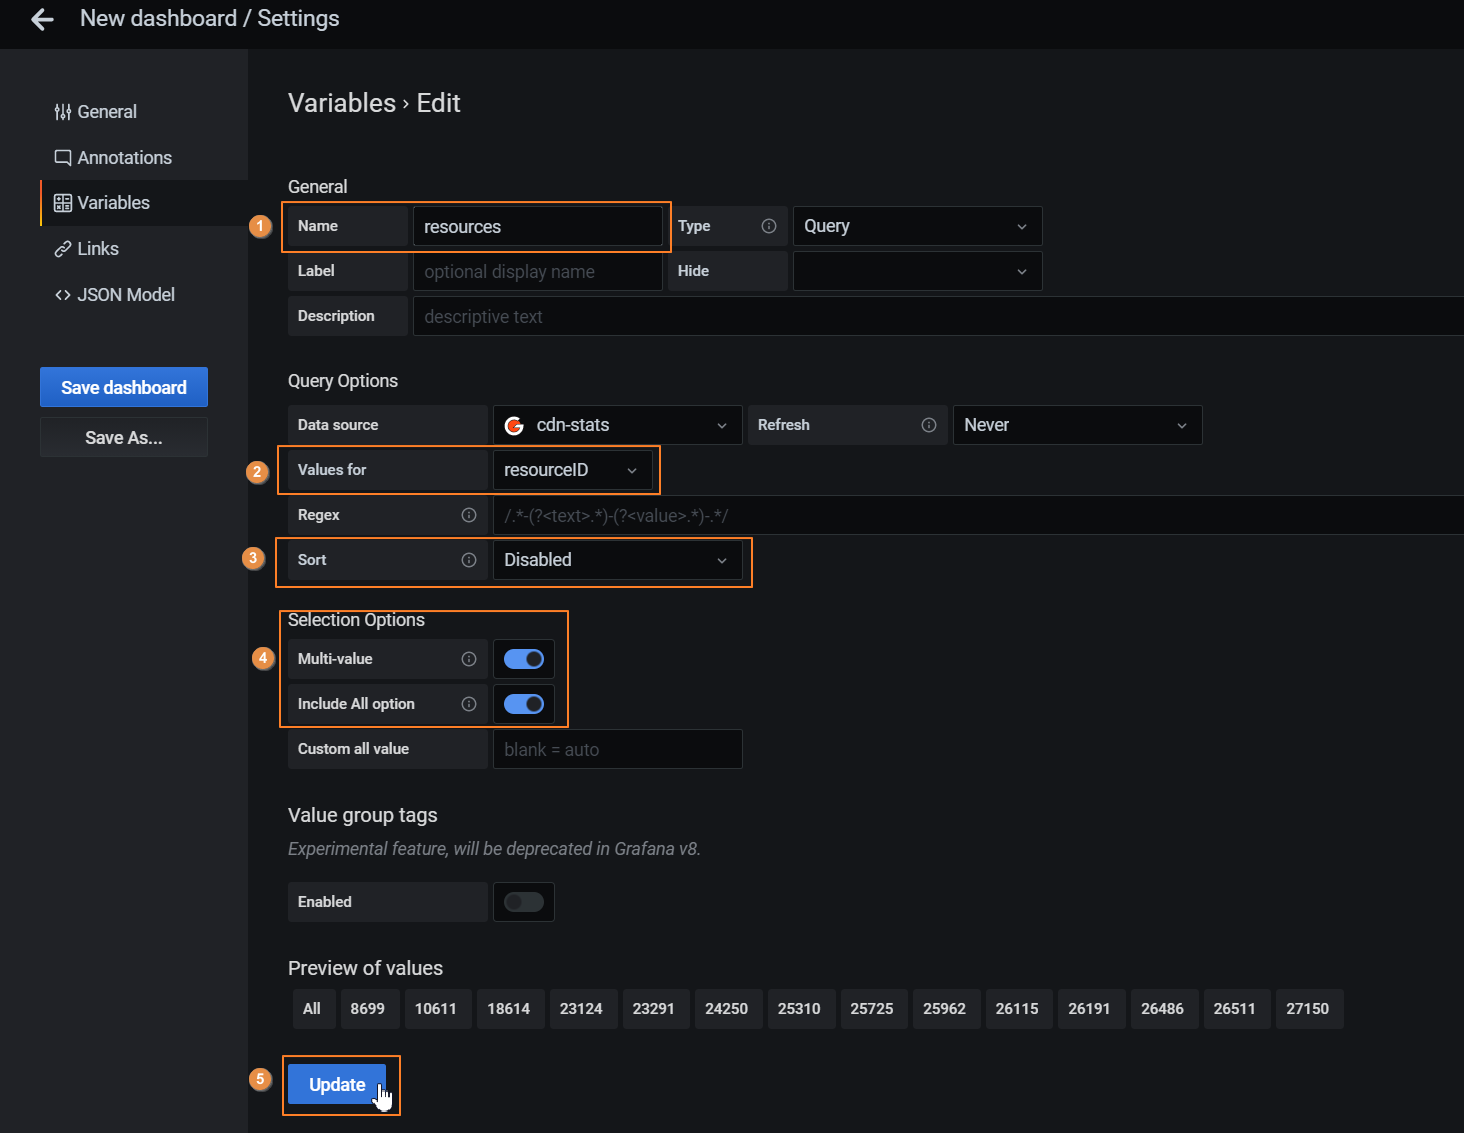
- In the Name you can specify the variable name (required).
- In the Values for you can select a value for the variable: resourceID (resources).
- In the Sort you can set the sorting order of the elements (optional)
- In the Selection Options you can set the way of how elements can be selected (optional)
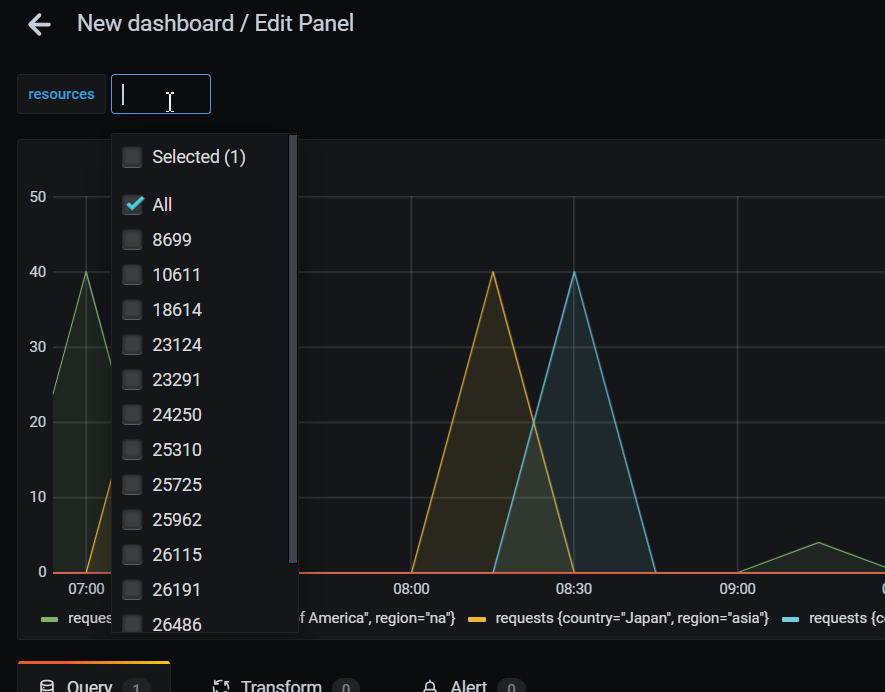
- In the Multi-value you can set the ability to select multiple elements.
- In the Include All option you can set the ability to select all elements by marking the All value.